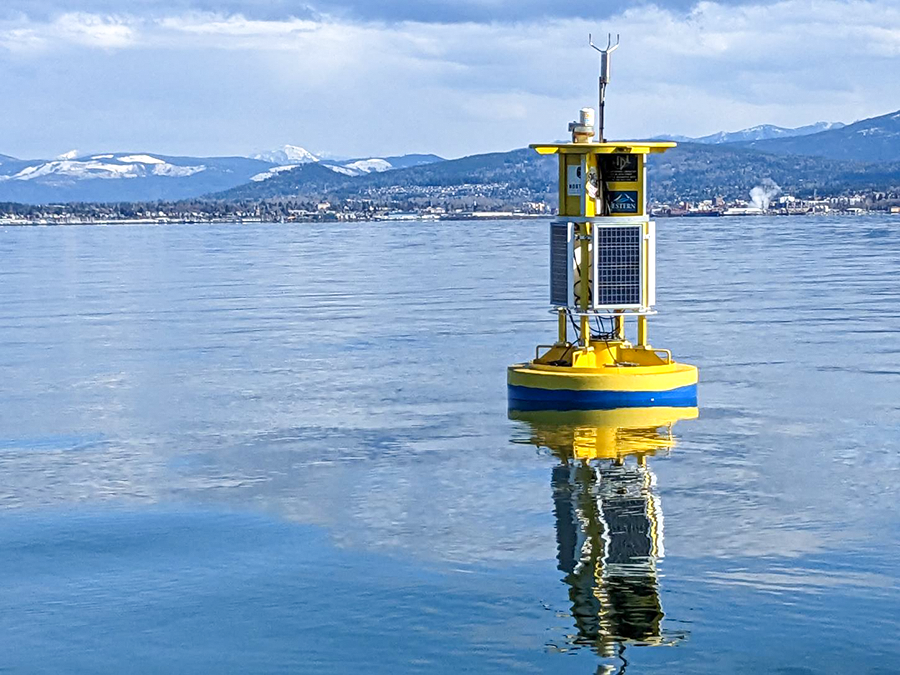
NANOOS partners have redeployed the Se'lhaem Buoy, located in Bellingham Bay, Washington. The buoy, co-designed with the Lummi Natural Resources Department, is a collaboration between the Northwest Indian College, Western Washington University, and Northwest Environmental Moorings Group at APL-UW. The buoy collects and transmits near-real time data for wind, air temperature, water temperature and salinity, and more. The Se'lhaem buoy was first deployed in 2016, and has provided data for researchers, students, and Tribes to observe and learn about the state of the environment in Bellingham Bay.
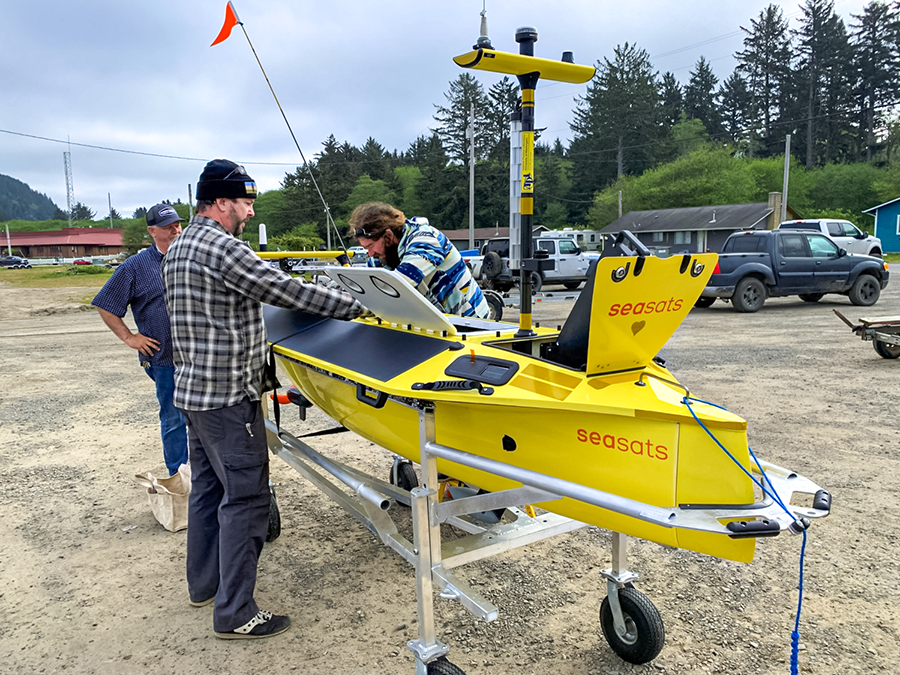
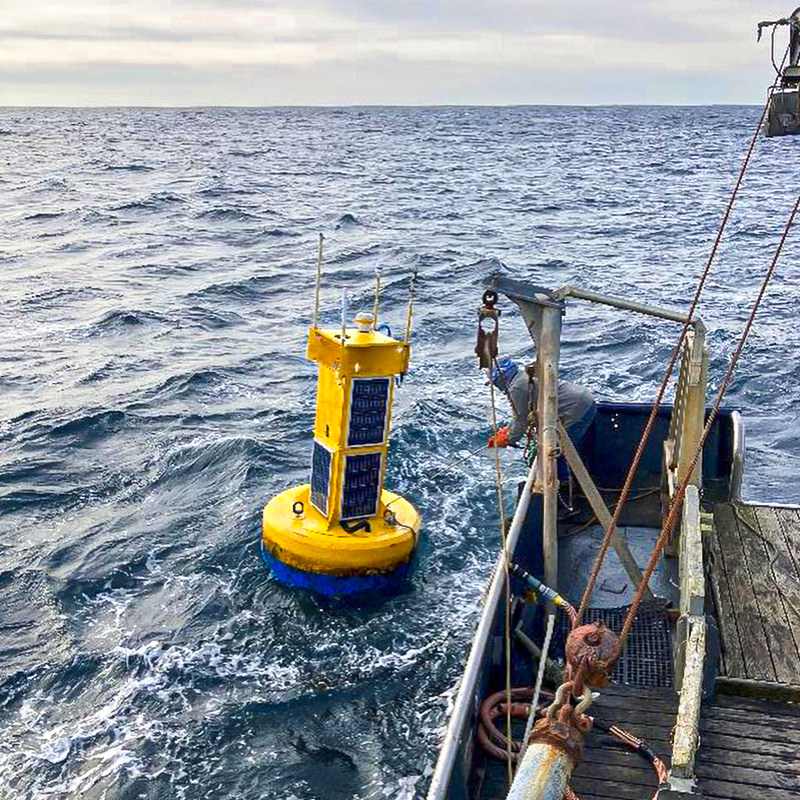
The buoy team from UW-APL successfully deployed the IOOS OTT-funded SeaSats Lightfish Kum'-tuks (Chinook jargon for "To know/understand") off the coast of Washington aboard the Olympic Coast Sanctuary's vessel R/V Storm Petrel. The solar-charged autonomous surface vehicle, augmented with a water sampling system designed and built by APL-UW, collected 16 offshore water samples for HAB toxin analysis from La Push to Neah Bay. Surface data from its journey are available on NVS Autonomous Vehicles.
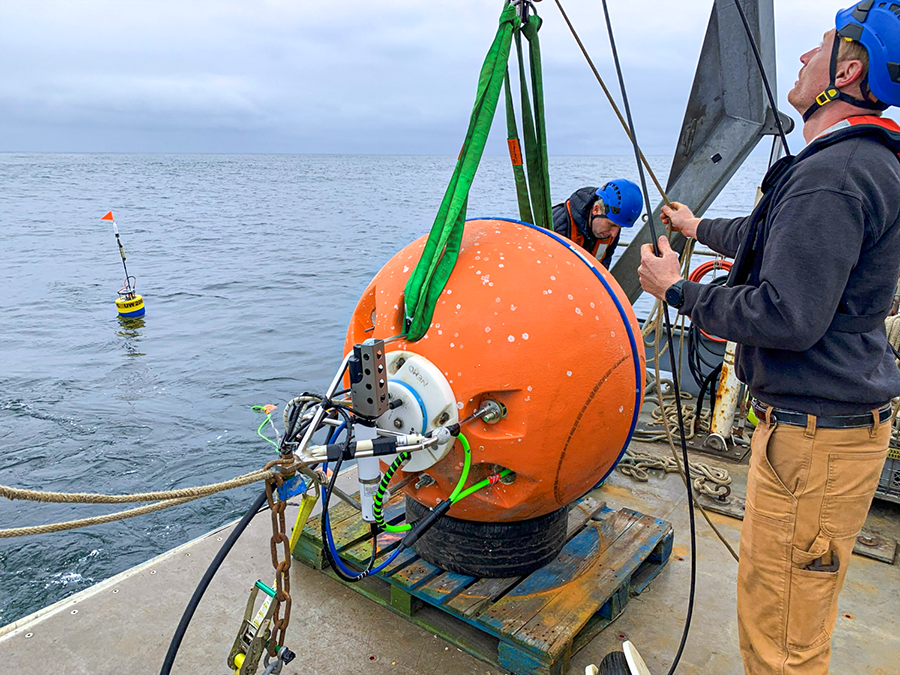
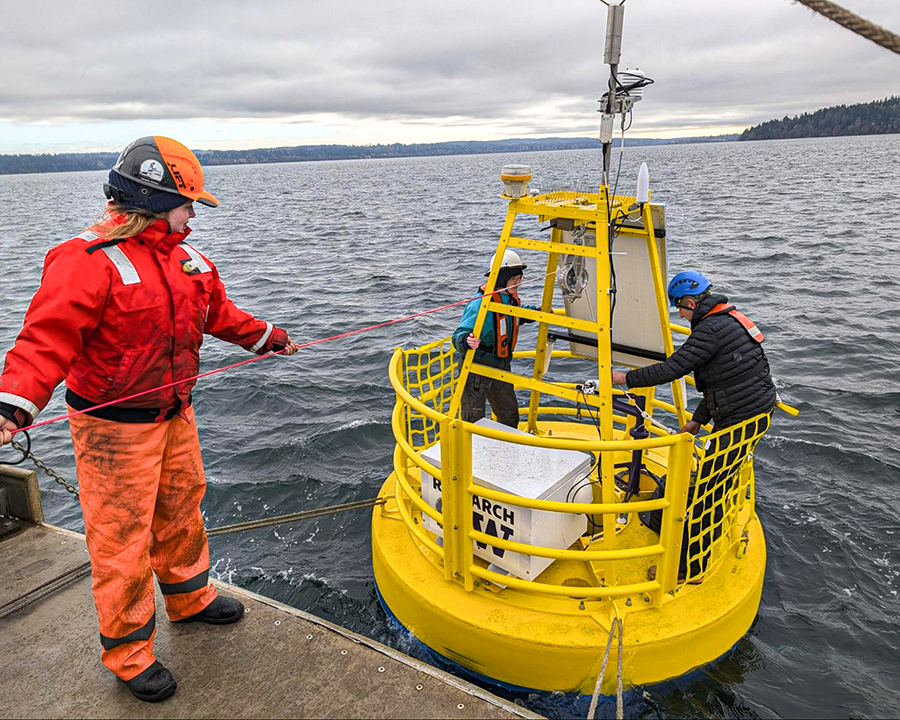
The buoy team from UW-APL made many deployments off the coast of Washington aboard the Olympic Coast Sanctuary's vessel R/V Storm Petrel. This included Cha'ba, the NEMO-subsurface profiling mooring, and the harmful algal bloom (HAB)-toxin-measuring ESP mooring. These systems provide valuable real-time in-situ observations of ocean conditions and help us better understand issues like hypoxia, ocean acidification, HABs, marine heat waves, etc. The UW team also worked with Jennifer Hagen, Quileute Tribe marine biologist, to deploy the Quileute Tribe's North and Central spotter wave buoys as part of the Backyard Buoys program, now funded through NANOOS IOOS IRA funds.
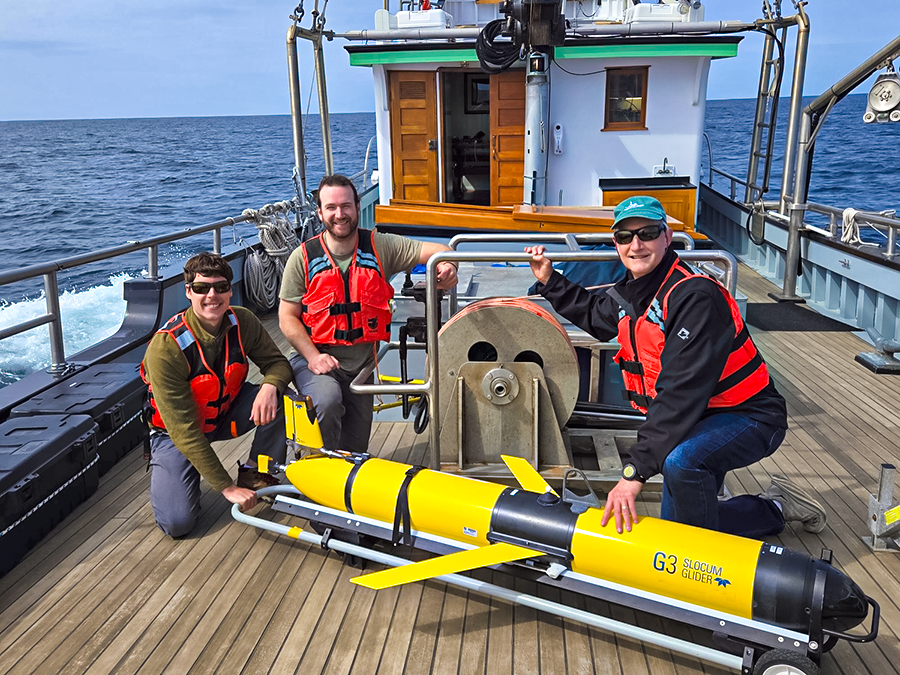
The OSU glider team led by NANOOS PI Jack Barth joined the restored historic R/V Western Flyer's Pacific Northwest expedition to deploy an autonomous underwater glider off the coast of Washington. These glider deployments are a collaboration with the Columbia River Inter-Tribal Fish Commission and the Quinault Indian Nation and provide invaluable data to better understand regional concerns like hypoxia, HABs, and rising water temperatures.
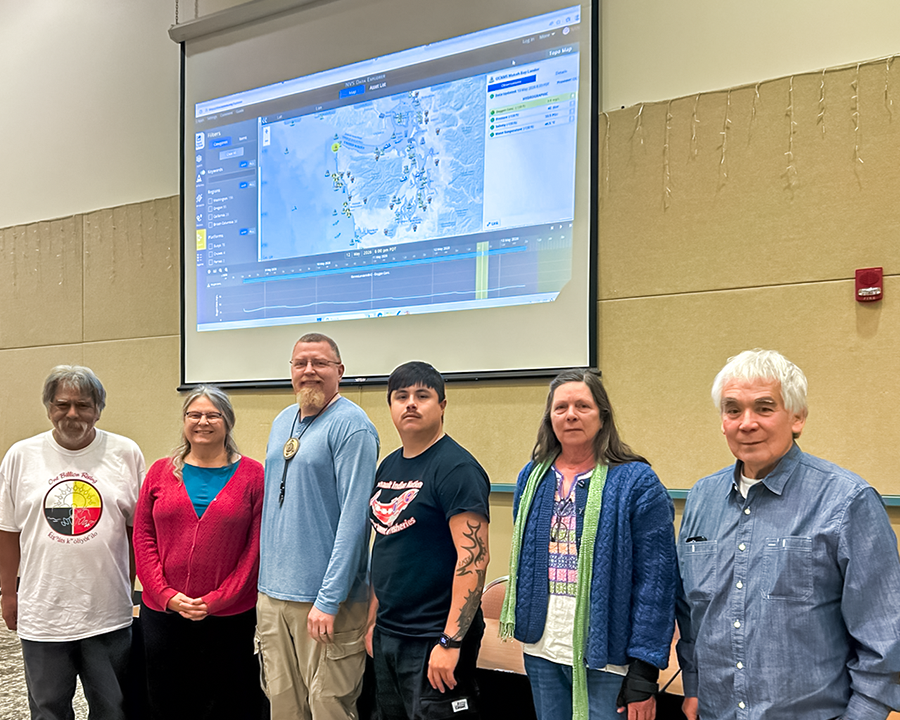
We are so excited to announce that two of the NOAA Olympic Coast National Marine Sanctuary (OCNMS) seasonal moorings have now been redeployed with real-time capabilities, thanks to technological expertise from NANOOS and funds from a NOAA Climate Program Office award (Newton et al.) and the Washington Ocean Acidification Center! OCNMS has maintained seasonal moorings from Cape Flattery to Grays Harbor since 2000, now designated as a NOAA Ocean Acidification Sentinel Site. OCNMS mooring data are highly valuable to the region but until now could only be accessed after the season. See hourly real-time data from the OCNMS sensors served through NVS. This has been a great partnership of the OCNMS working with us at NANOOS and with other partners to make this long-held wish a reality. Photo shows participants from the Coastal Treaty Tribes, OCNMS, and NANOOS at the recent OASeS (Olympic Coast Ocean Acidification Sentinel Site) Annual Summit; the backdrop is showing the live data on the screen.
NOAA's most recent West Watch was held on 20 January 2026. The webinar summarized coastal environmental conditions and impacts in the Western Region, focusing this time on a marine heatwave in the northeast Pacific Ocean. The webinar included contributed slides from the NANOOS, CeNCOOS, and SCCOOS regions, who regularly report on their local coastal ocean conditions. Contact us at NANOOS if you want to participate in the next webinar and please let us know if you have any comments.
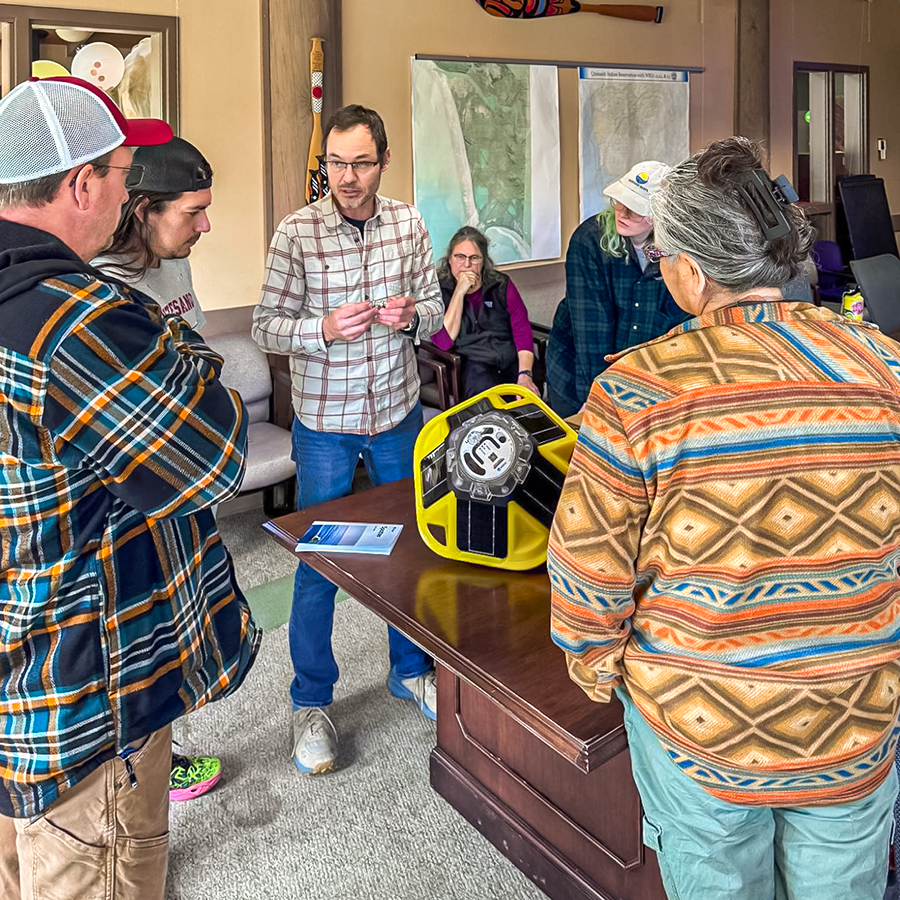
Backyard Buoys members from the University of Washington led a training session at the Quinault Indian Nation Division of Natural Resources in Taholah, WA, on March 31, 2026. Quinault Indian Nation community members learned more about the wave buoy, data collection, and mooring strategy. The hands-on training led to many comments on how deploying a Backyard Buoys wave buoy seemed similar to other fishing practices, just a different application of using lines, weights, buoys, splicing, and anchoring. We look forward to continued operations led by the community.
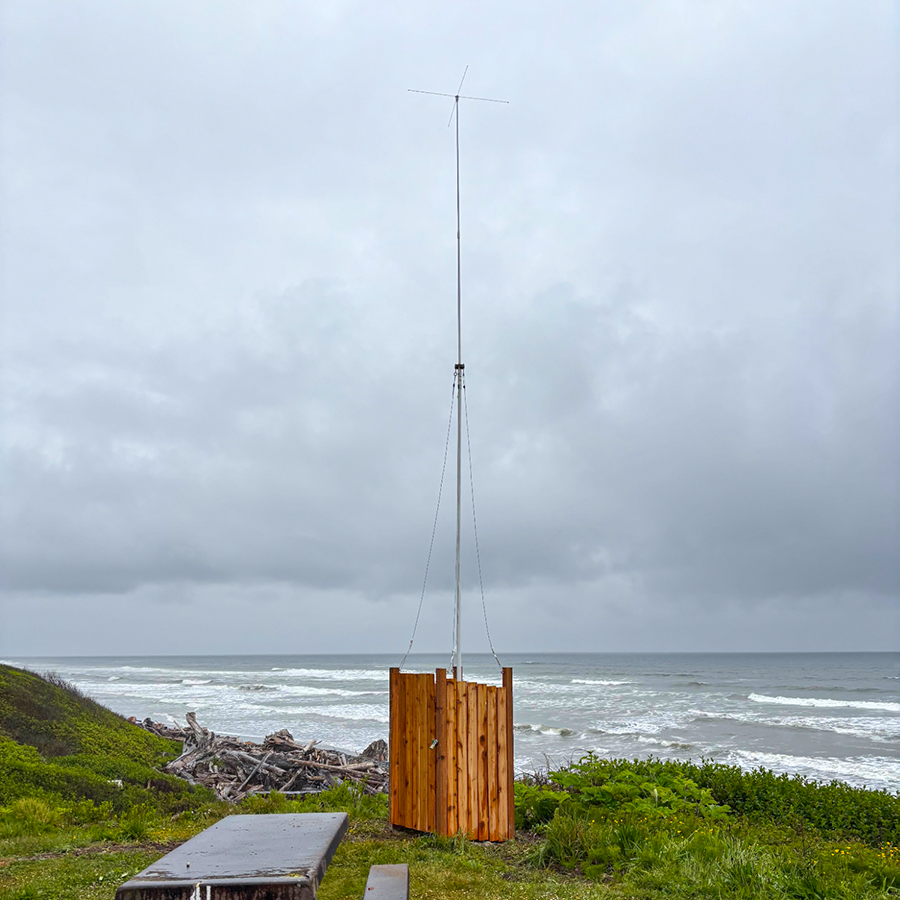
NANOOS is proud to announce that the newest HFR installation at Kalaloch, WA, is operational and data are viewable from NVS as well as the national HFR Network display. This and the Westport, WA, HFR installation just to the south were part of a "Fill the Gaps" campaign that IOOS mounted several years ago. We are so pleased to have these data for the local fishing season, search and rescue, HAB tracking, and other applications. Kudos to Mike Kosro and Matthew Srouffe, OSU, for this major lift.
NANOOS is excited to provide a new tool on NVS that visualizes model output conditions throughout the water column along a path. Choose a model (LiveOcean or OSU ROMS), then users can select an existing Transect or create their own by clicking the "New Transect" button at the top of the "Transects" panel then clicking on the map to add points. Double-click to add the last point. Then select the variable and day/time of interest. Log in to save the Transect, which can be edited (change locations, name, color). Use the "Divider" function to expand the surface layer resolution. As always, let us know your thoughts in the Comments.
The Northwest Environmental Moorings Group, partnered with NANOOS and MRV Systems, LLC, with funding through the NOAA IOOS office and made possible through a Community Project supported by Rep. Pramila Jayapal, have successfully deployed the second of their redesigned ORCA profiling moorings at the entrance to Hood Canal, near Hansville, Washington. The buoys collect wind, air temperature, and water quality parameters, such as water temperature, salinity, and dissolved oxygen. A profiling float attached to the buoy collects the water quality parameters as it moves vertically, sampling at all depths. The buoy has gone through a complete redesign to allow for greater reliability of data access while improving the safety and resilience of the platform. Find the data online!
Ahead of its 2025 deployment, CRITFC's CMOP Field Team completed a major refurbishment and modernization of the Columbia River Plume buoy (SATURN-02)—CMOP's largest and most complex buoy, thanks in part to IIJA funds received from IOOS. This effort marked the first time the program's new field staff fully rebuilt, upgraded, and deployed the buoy. Key improvements included integrating and coding a new microcontroller to manage buoy operations and real-time communications, as well as upgrading to improve safety and recovery operations. The buoy successfully collected and telemetered biogeochemical data during the 2025 coastal upwelling season. This effort strengthened the resilience of a critical observing asset and demonstrated CMOP's growing in-house capacity to build, deploy, and operate advanced ocean observing systems.
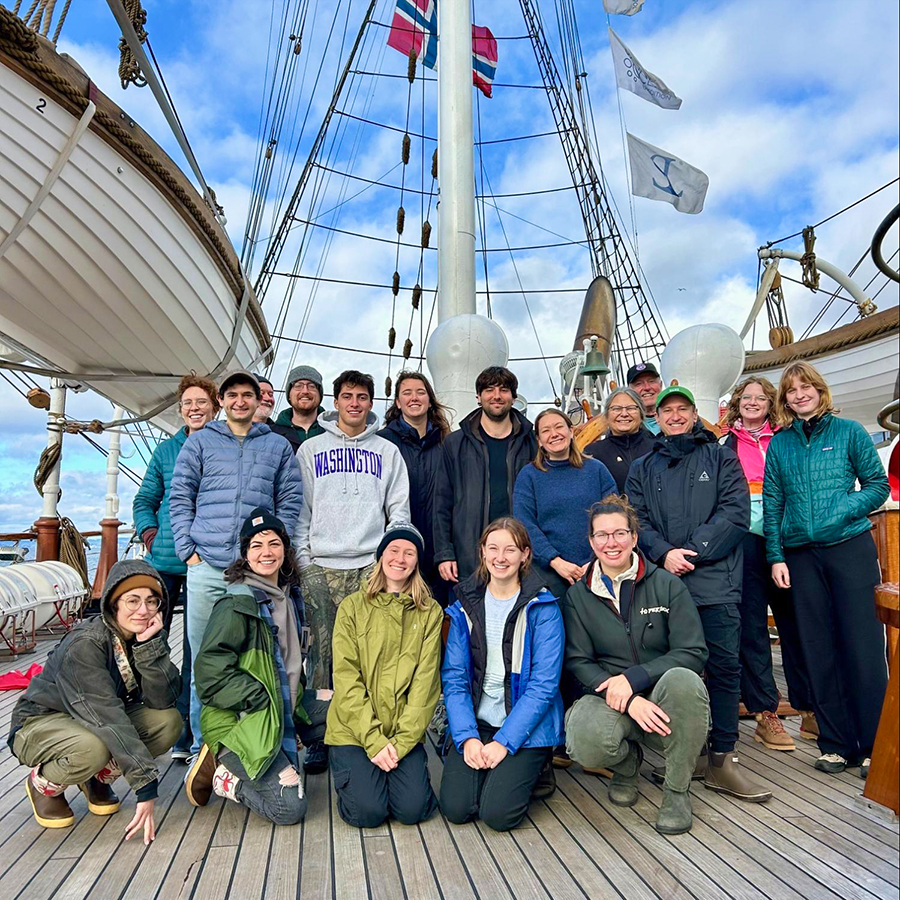
NANOOS was honored to participate in Maritime Blue’s One Ocean Week welcoming the historic tall ship Statsraad Lehmkuhl to Seattle on its One Ocean Expedition, a UN Decade effort to raise global awareness for our ocean. We worked with partners and students to showcase research, technology, and data products at the Vast and Deep Ocean event aboard the ship on 24 October. Then a team from NANOOS and UW, including 11 students, joined the crew and sailed 915 miles to San Francisco. Everyone worked together steering the ship, hoisting sails, scrubbing decks, as well as collecting water samples, net tows, and CTD casts along the way. It was truly an experience of a lifetime that we will never forget.
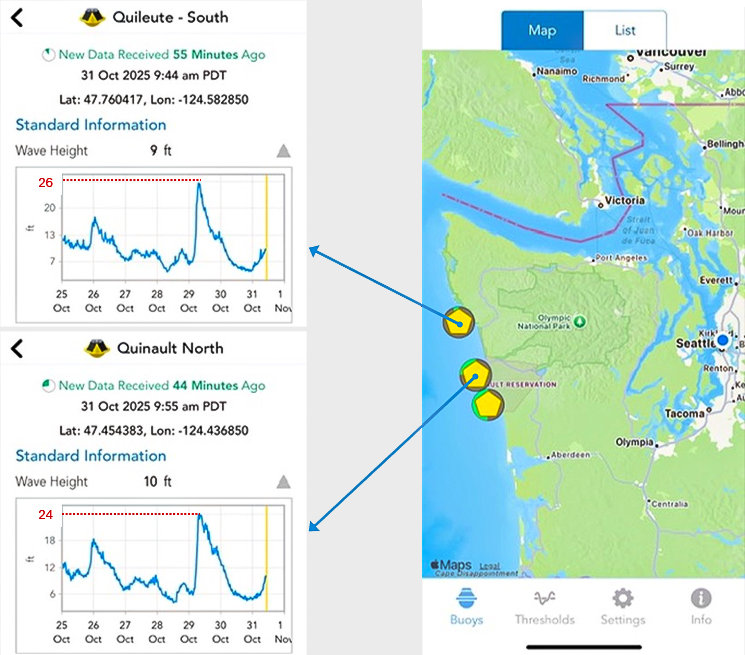
During a late October storm, both Quileute Tribe and Quinault Indian Nation’s Backyard Buoys reported wave heights topping 24 ft! In these extreme wave conditions, the Quinault Middle buoy broke free from its anchor and drifted north. NANOOS, Backyard Buoys, and our Quinault Indian Nation partner Joe Schumacker extend a sincere THANK YOU to the US Coast Guard Station Quillayute River for swiftly rescuing this buoy, and to Jennifer Hagen, another Backyard Buoys partner for the Quileute Tribe, for her coordination of the rescue mission.
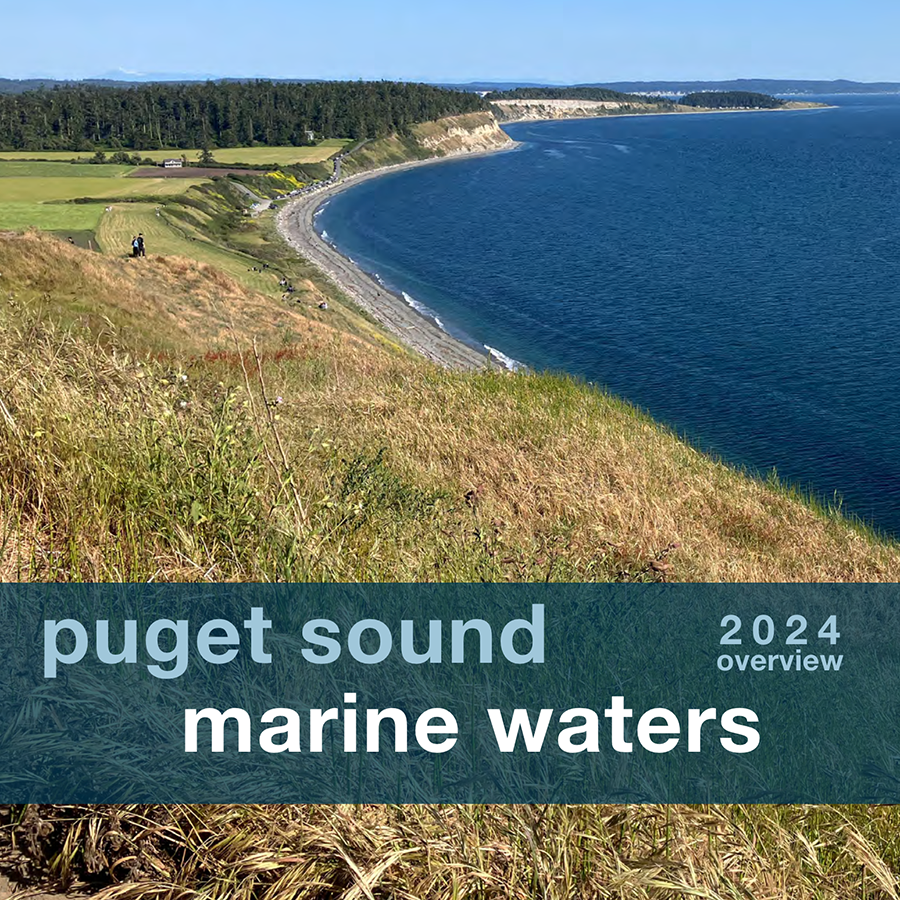
A comprehensive look at Puget Sound marine conditions for the year 2024 is now available. Physical, chemical, and biological information, ranging from large-scale climate variations to local biota monitoring, is summarized to provide a thorough overview of conditions in Puget Sound and the surrounding area during 2024. The report includes many contributions from NANOOS, and is published as part of the Puget Sound Ecosystem Monitoring Program.
NOAA's most recent West Watch was held on 23 September 2025. The webinar summarized coastal environmental conditions and impacts in the Western Region, focusing this time on a marine heatwave in the northeast Pacific Ocean. The webinar included contributed slides from the NANOOS, CeNCOOS, and SCCOOS regions, who regularly report on their local coastal ocean conditions. Contact us at NANOOS if you want to participate in the next webinar and please let us know if you have any comments.
Backyard Buoys is a collaboration between NANOOS, AOOS, PacIOOS, Sofar Ocean Technologies, and coastal Indigenous partners in each region on a community-led ocean observing project originally funded by the NFS Convergence Accelerator program. Backyard Buoys uses simple and affordable instruments, called "Spotters", to put access to and stewardship of ocean data in the hands of those most affected by unsafe sea conditions on the coast. This video highlights how two PNW communities, the Quileute Tribe and the Quinault Indian Nation, are using these low-cost buoys.
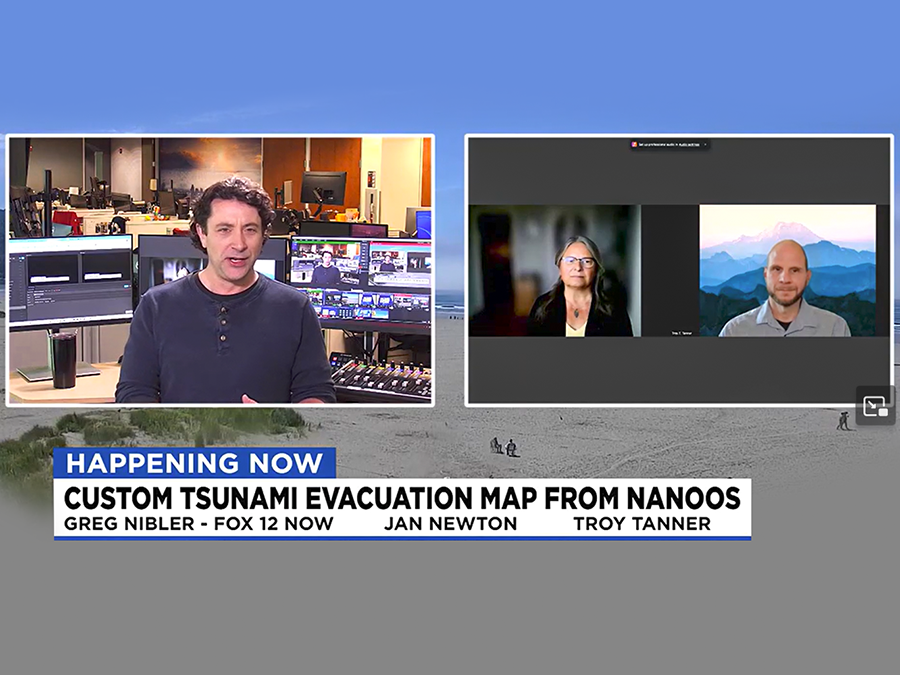
In the wake of the massive 8.8 magnitude earthquake that set off tsunami warnings across the Pacific, NANOOS members Jan Newton and Troy Tanner joined Fox 12's Greg Nibler to share information about our NVS Tsunami Evacuation app. They demonstrated how the app allows users to map their location, see if it’s in a tsunami zone, and plan a safe route.
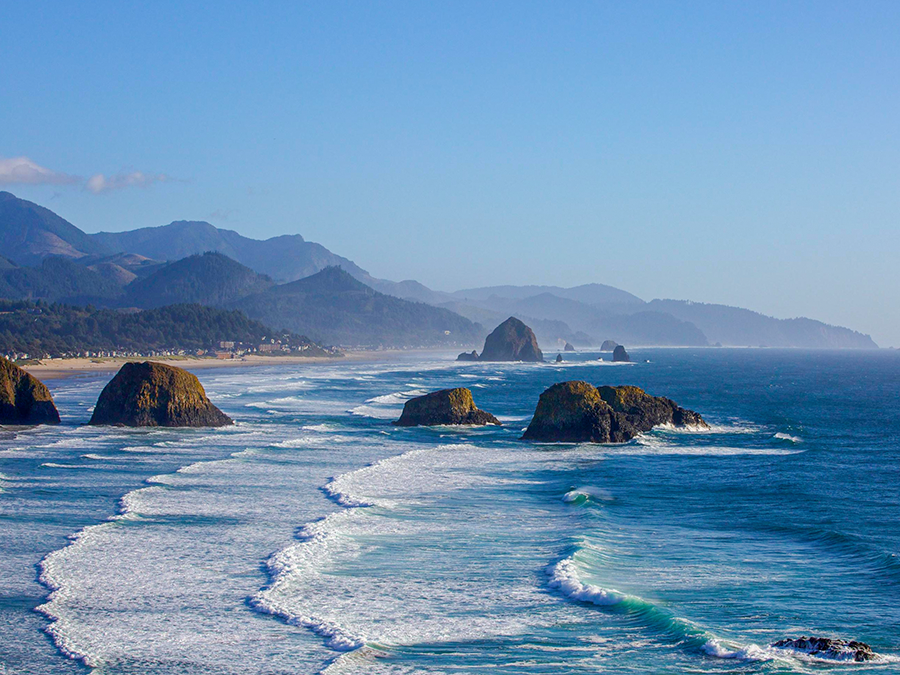
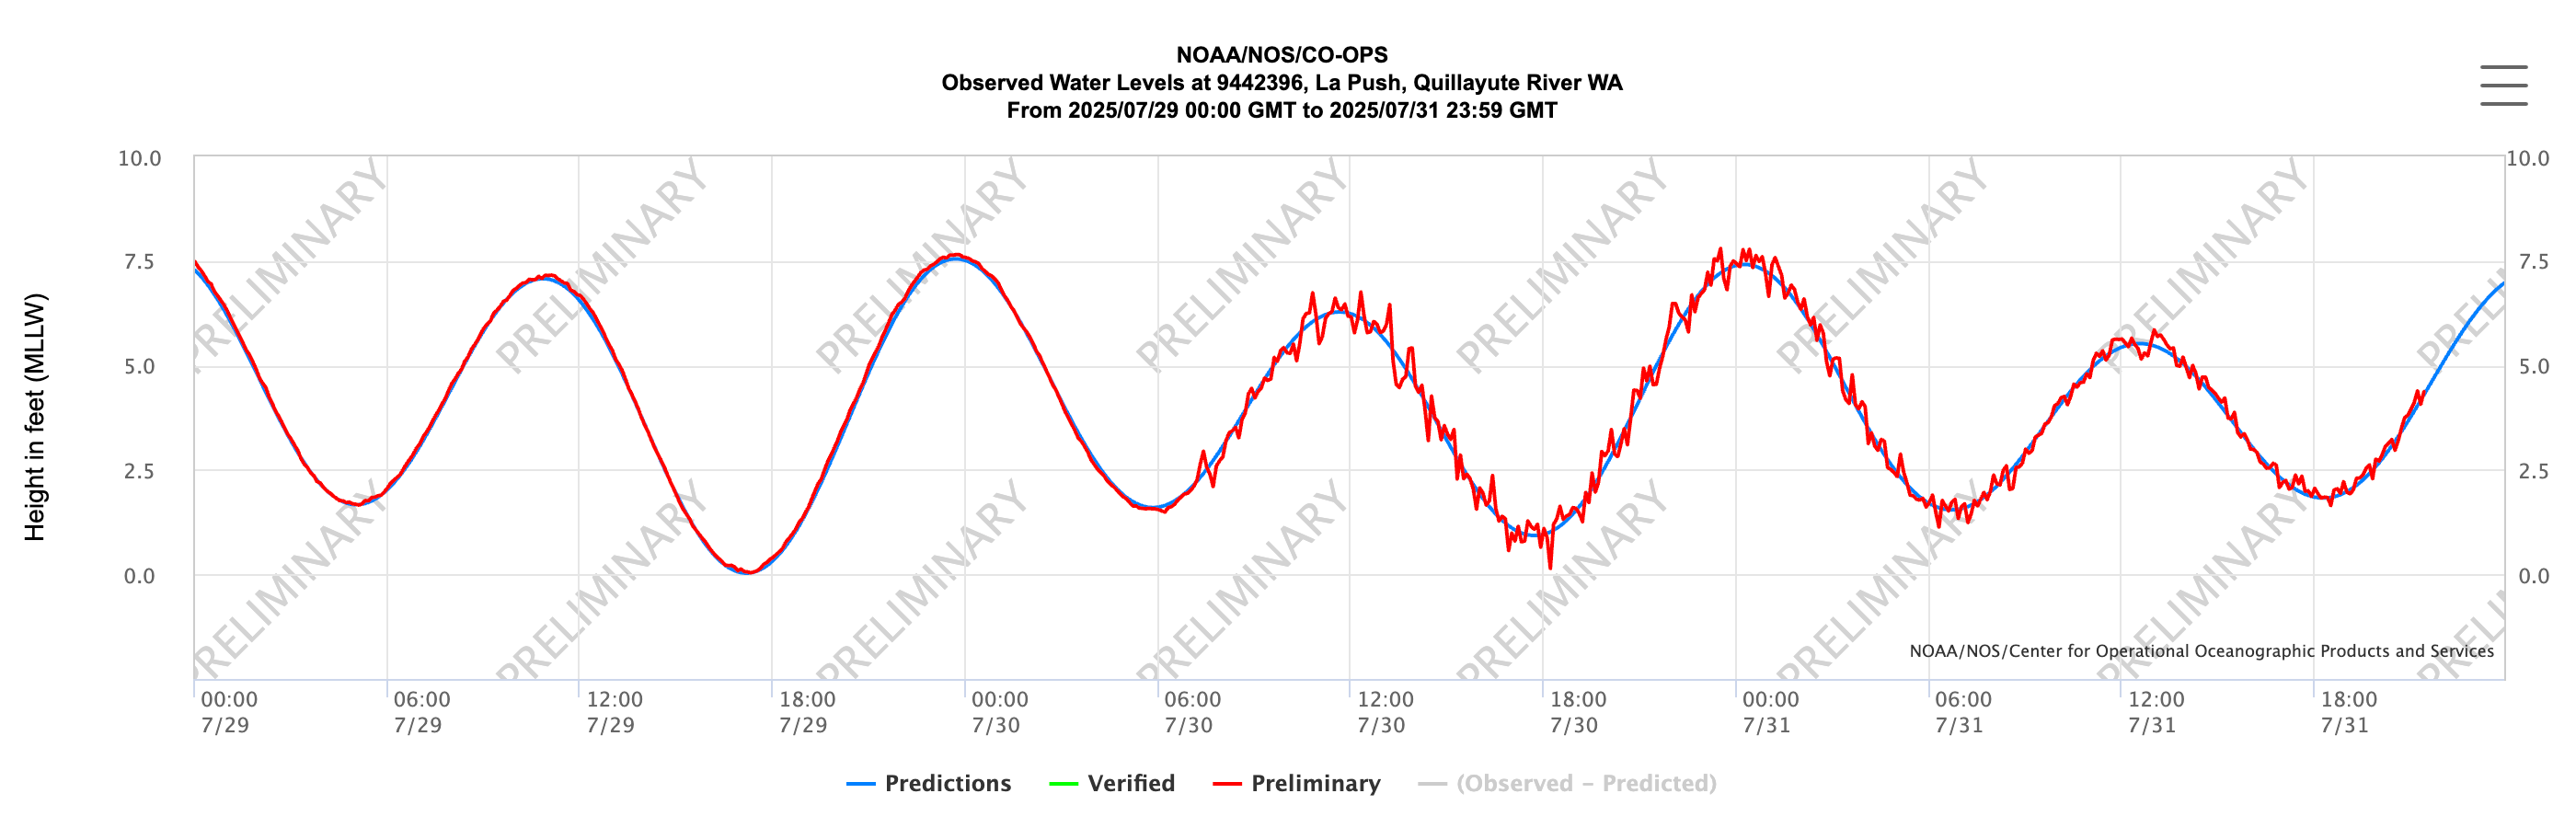
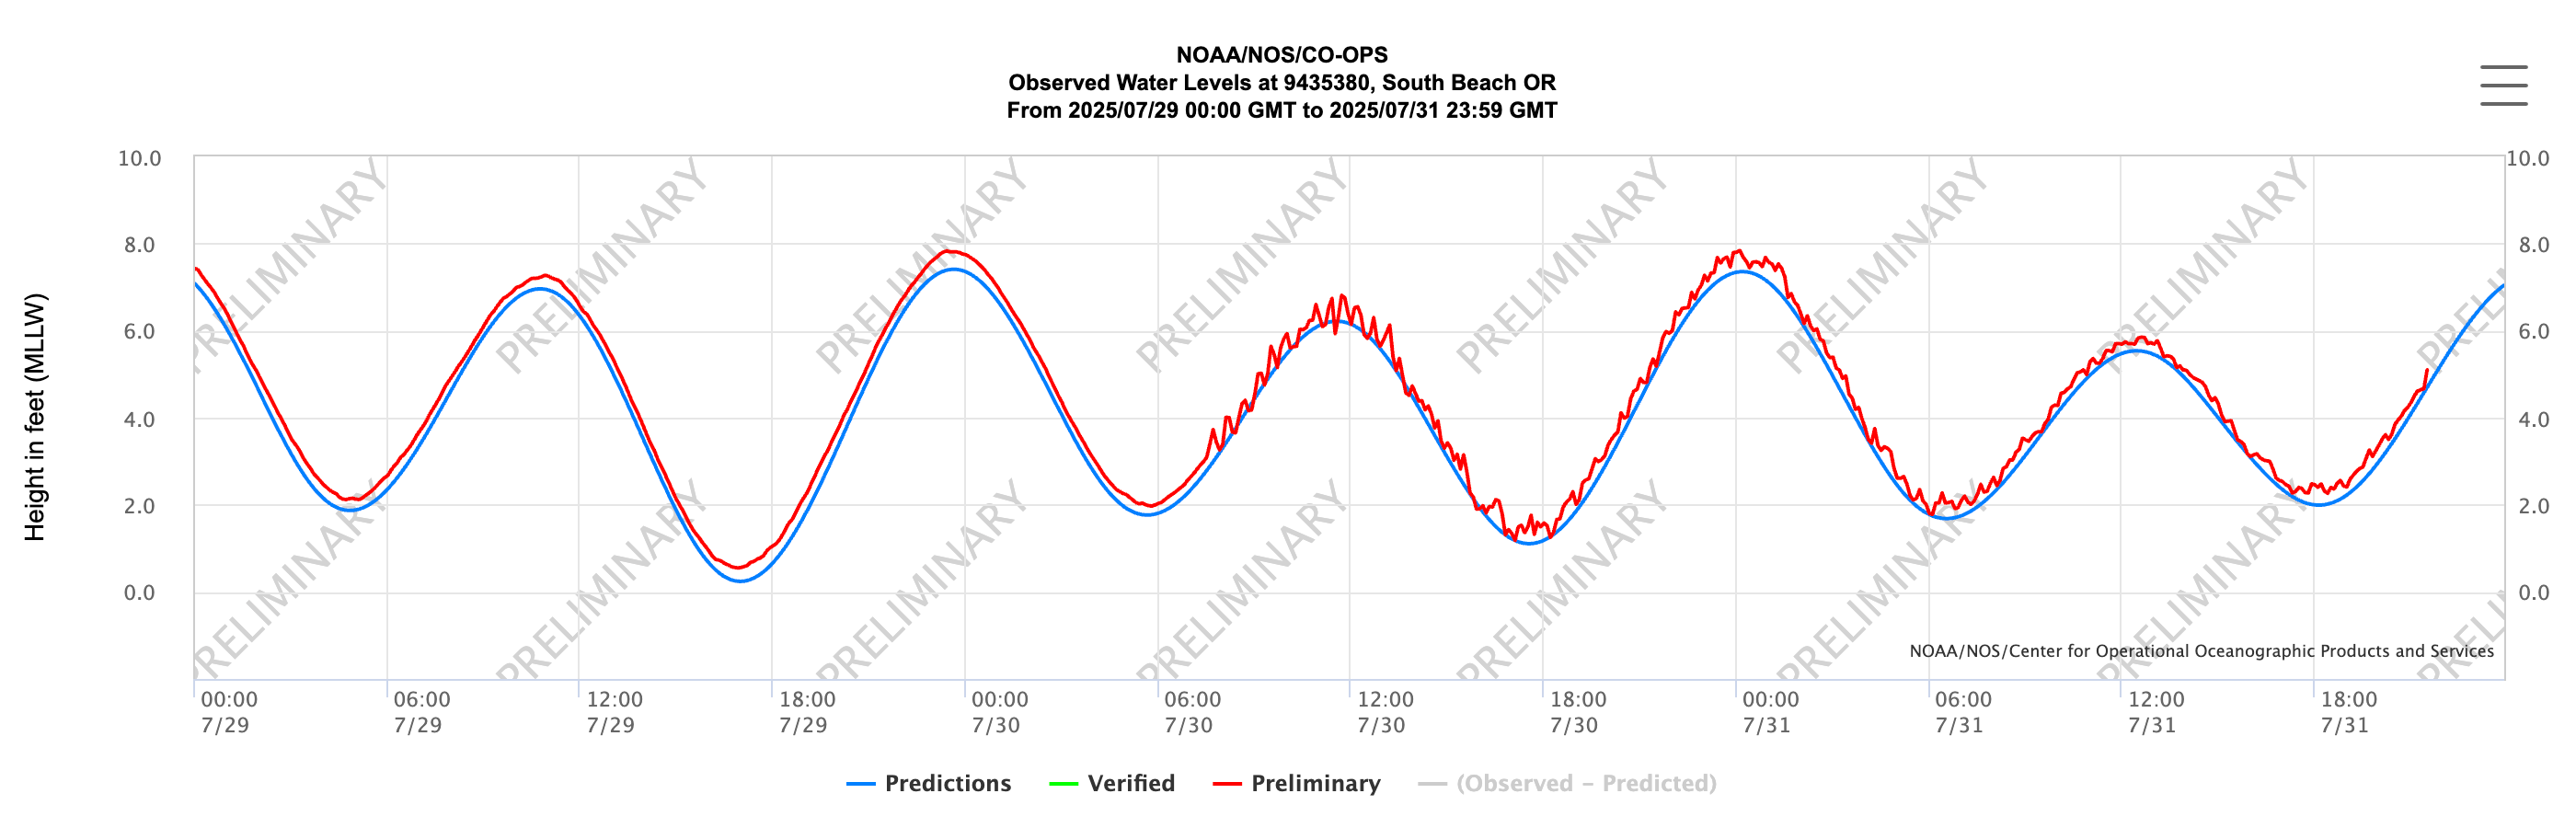
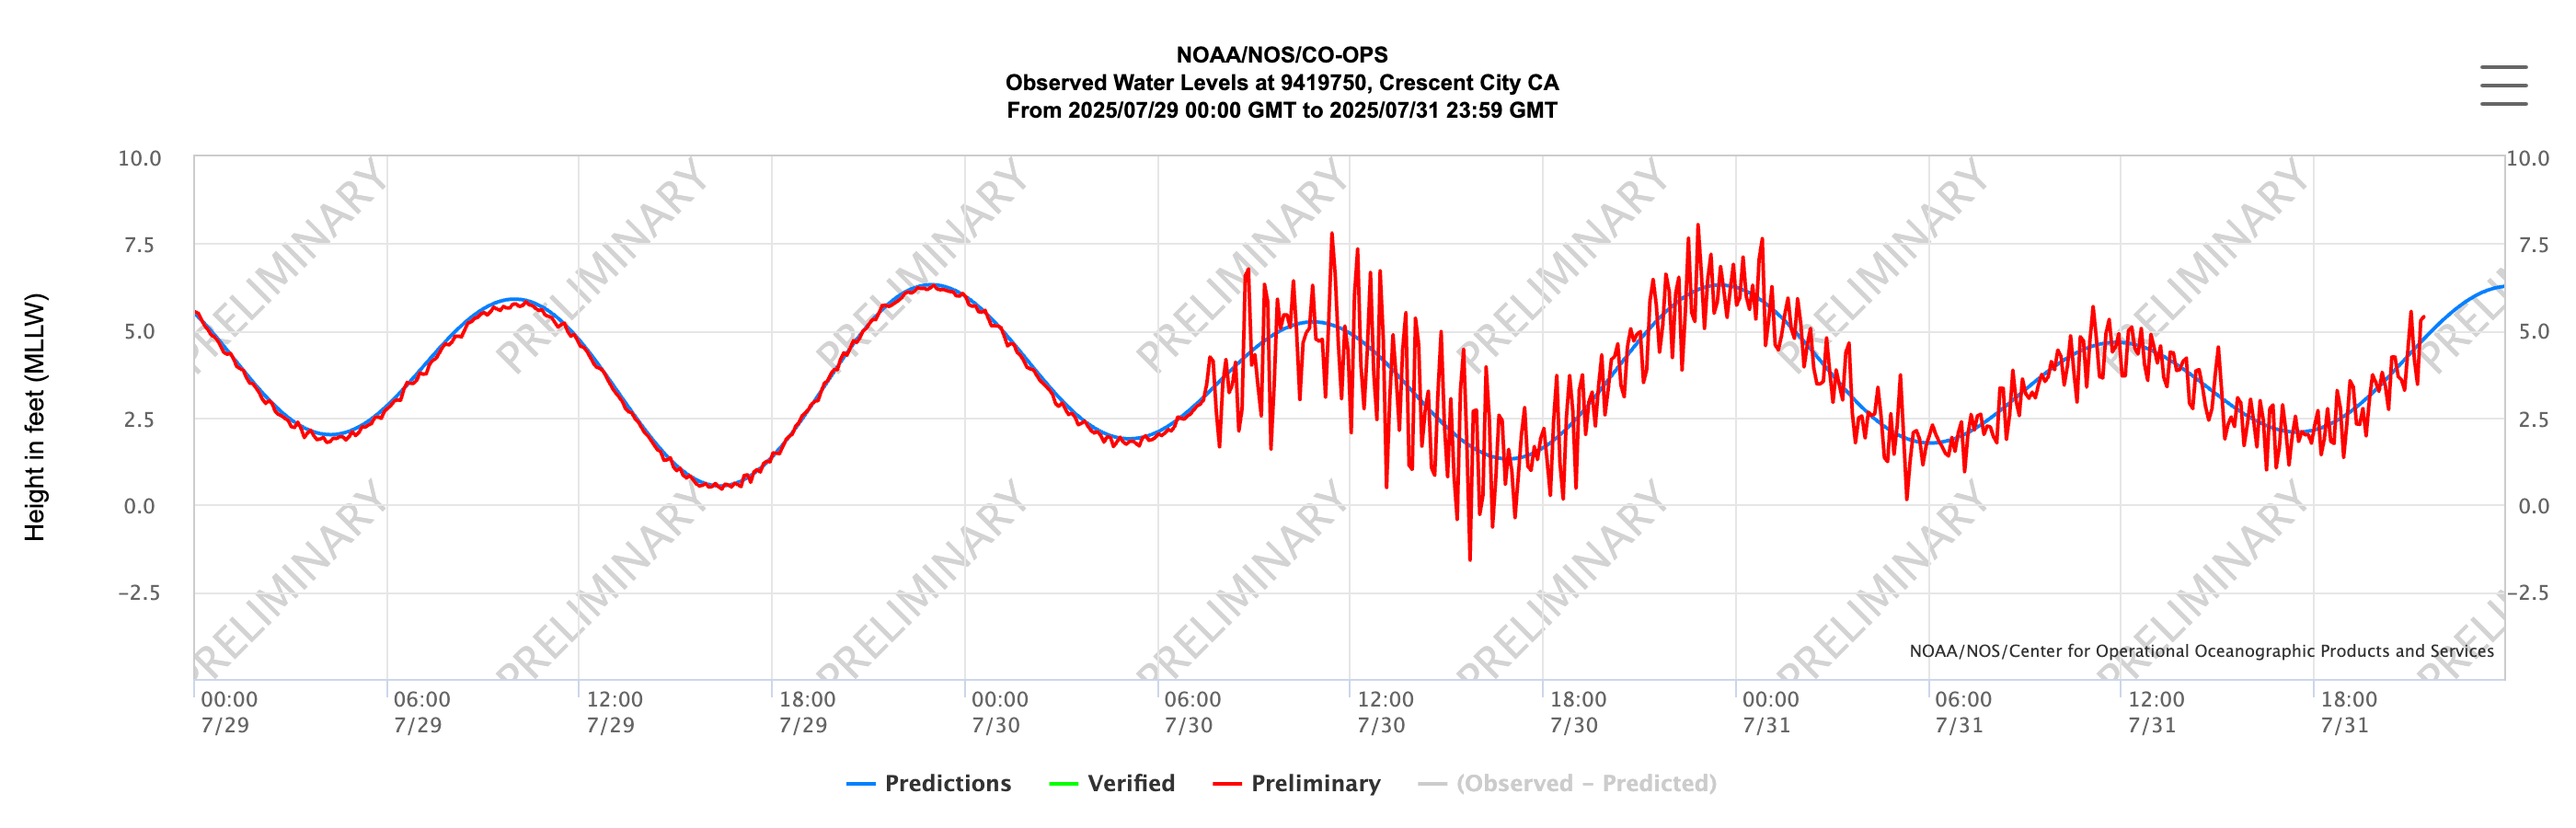
Curious about how the tsunami waves look? We see very different signatures depending on location. This is due to the geomorphology of the harbors and other factors. Click on the buttons below to view water levels for select regional sites, thanks to NOAA NOS. We appreciate that so many of you are using the NVS Tsunami Evac app. If you haven’t already, plot your evacuation route now, so you know it. Be aware that we pass along the bulletins created by the U.S. Tsunami Warning System. We do not create or filter tsunami bulletins, as the U.S. Tsunami Warning System is the authority for tsunami events. But use our app to find your safest evacuation route!
NANOOS is excited to announce an updated feature in NVS that allows users to “customize” the information presented within NVS. Set up the map view to display the region of interest, the assets (individual buoys, gages, and climate stations) and/or model overlay, etc. that you are interested in. Then select the "Share My View" tool to create a unique link that stores this information to be retrieved at any time. You can then share or revisit the link at any time to access data with your view. Log in to your NANOOS user account to save your "Views" for future use.
NANOOS Engagement Lead Rachel Wold and Ocean Coach Charlie Loos demonstrated the NVS Fishers web app, a free online tool that provides near real-time and forecasted data to help anglers visualize ideal fishing conditions and safe navigation. Features for tuna and salmon fishers include surface temperature and currents, chlorophyll, pycnocline, and thermocline, and forecasted bottom oxygen for crabbers. Other features include digital NOAA nautical charts, routing capabilities, and more. Thanks to Charles and everyone who joined us, and feel free to send us your feedback.

