
Sea Surface Height Anomalies
See current sea surface height (water level) anomalies both in the Pacific Northwest and for the U.S. West Coast. Yellow indicates higher than average.
Pacific Northwest
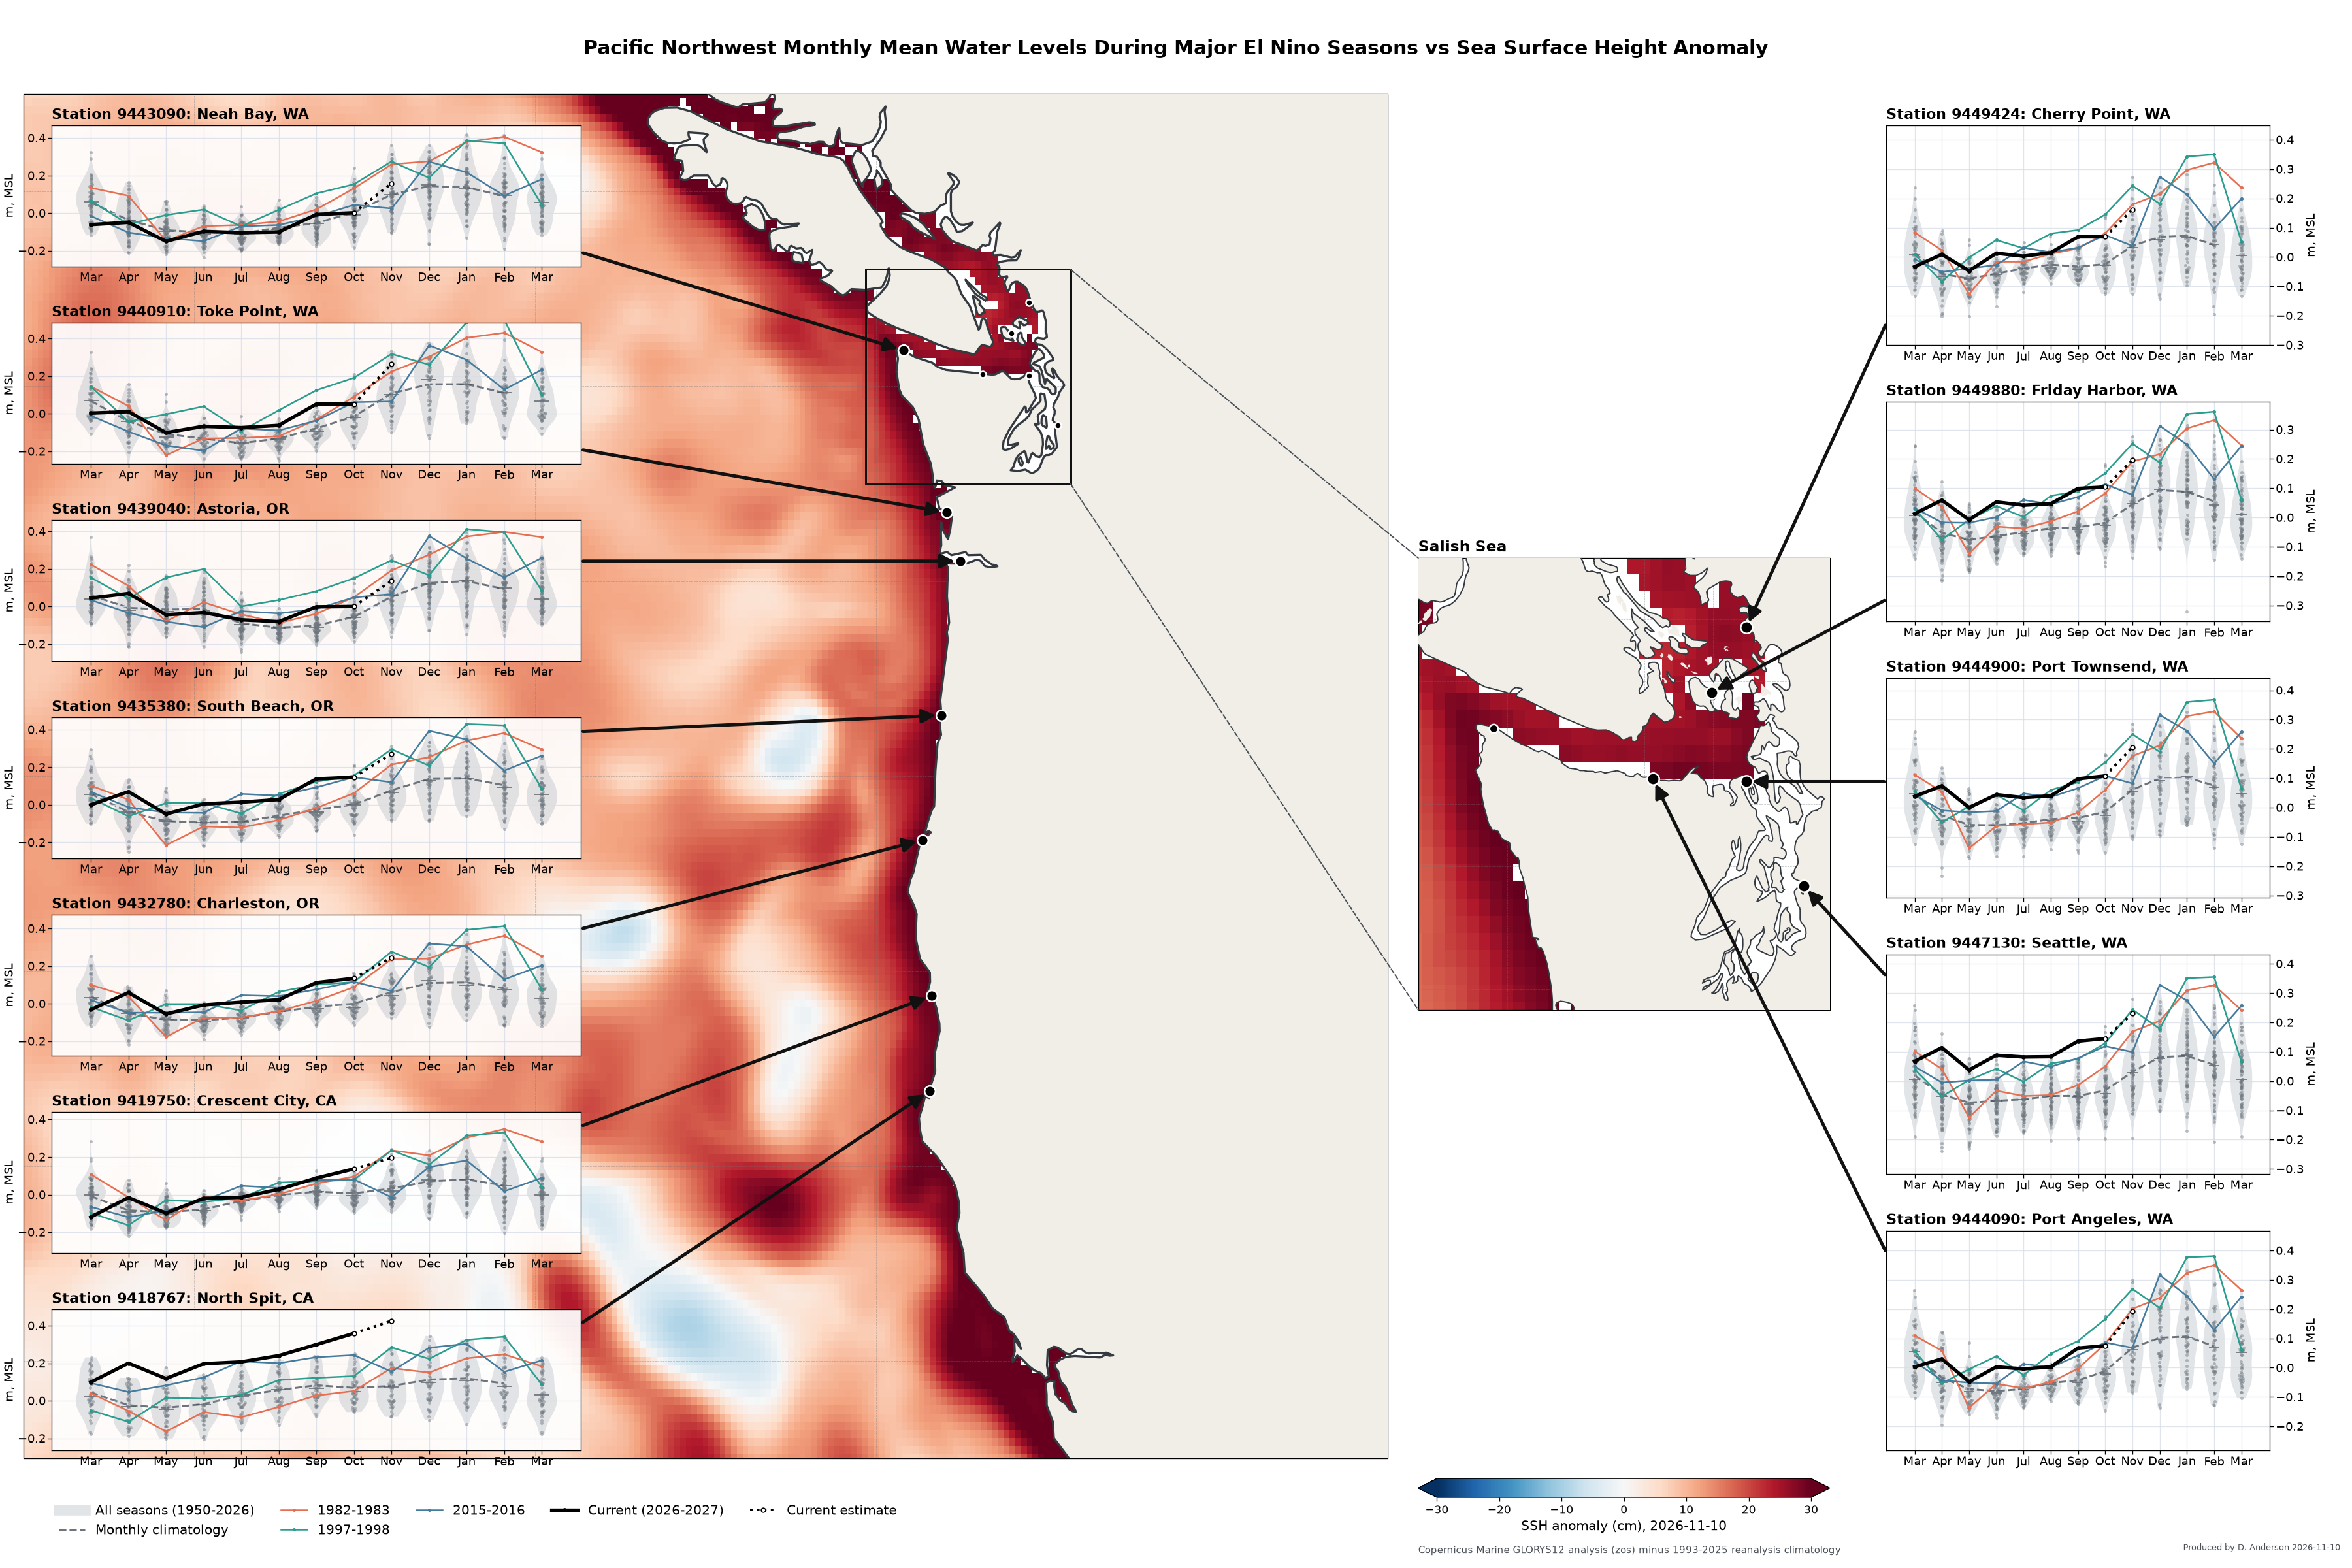
PNW Water Levels Timeseries

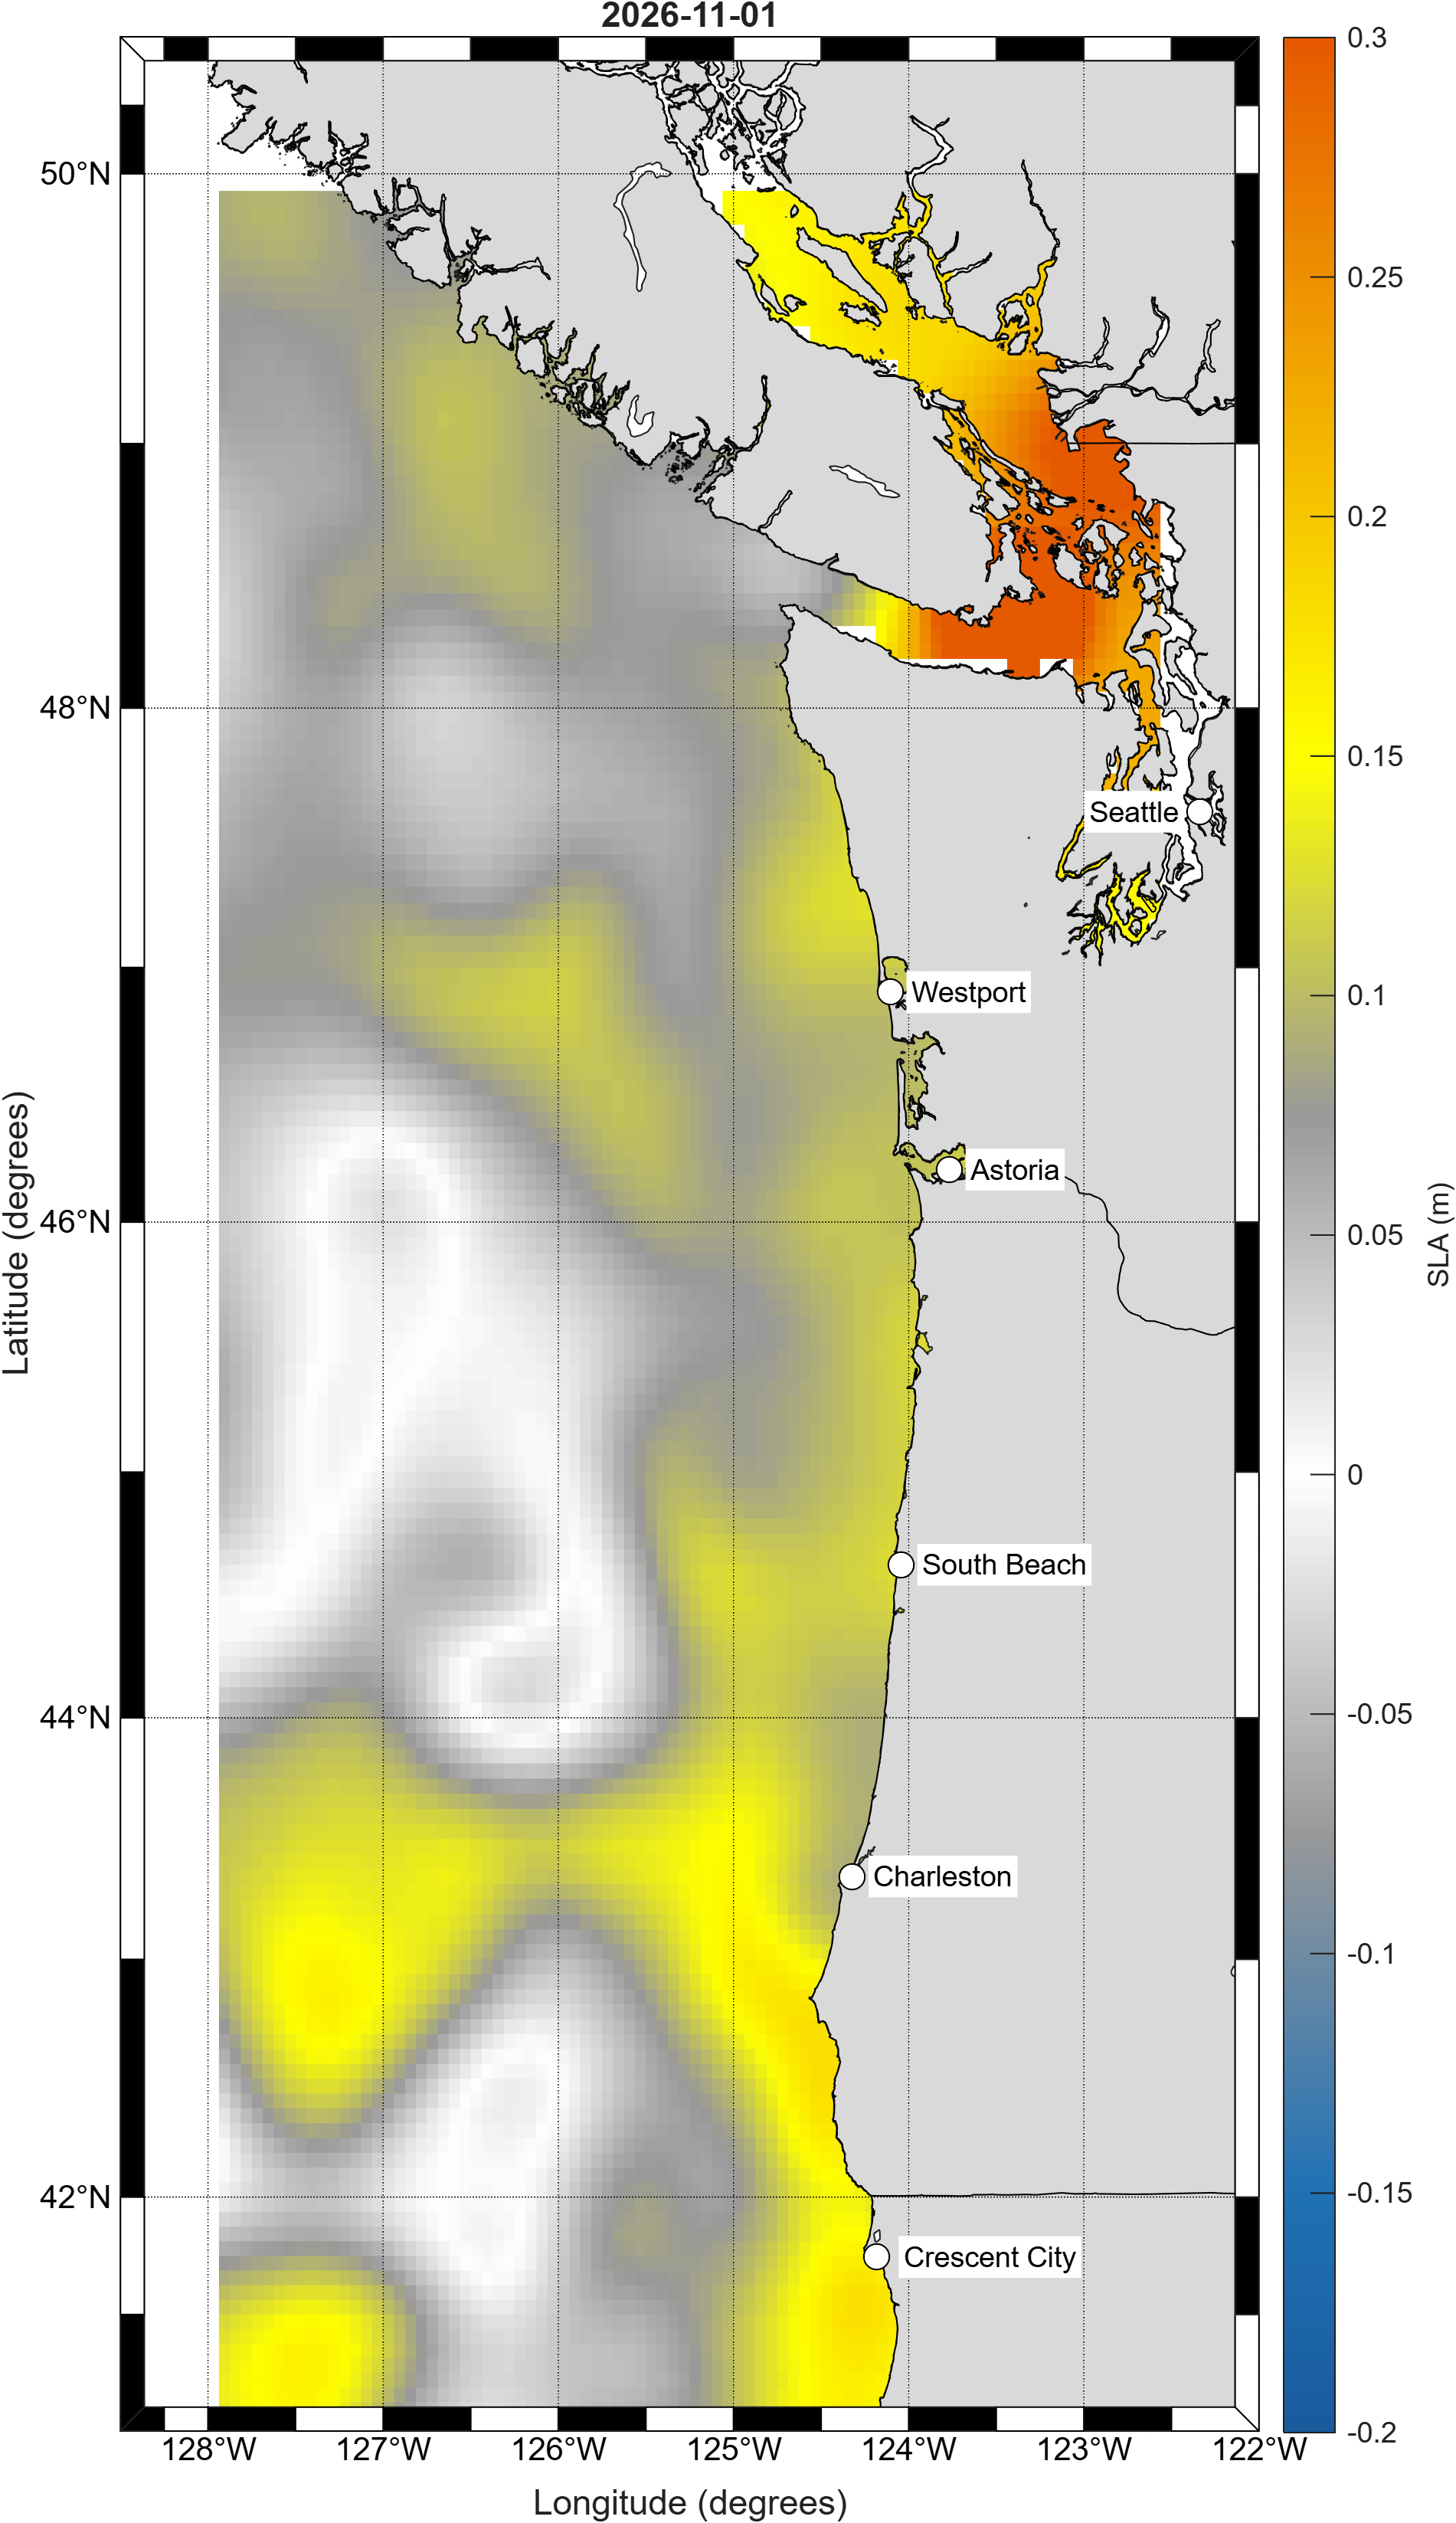
PNW SSH Anomaly Map
Latest
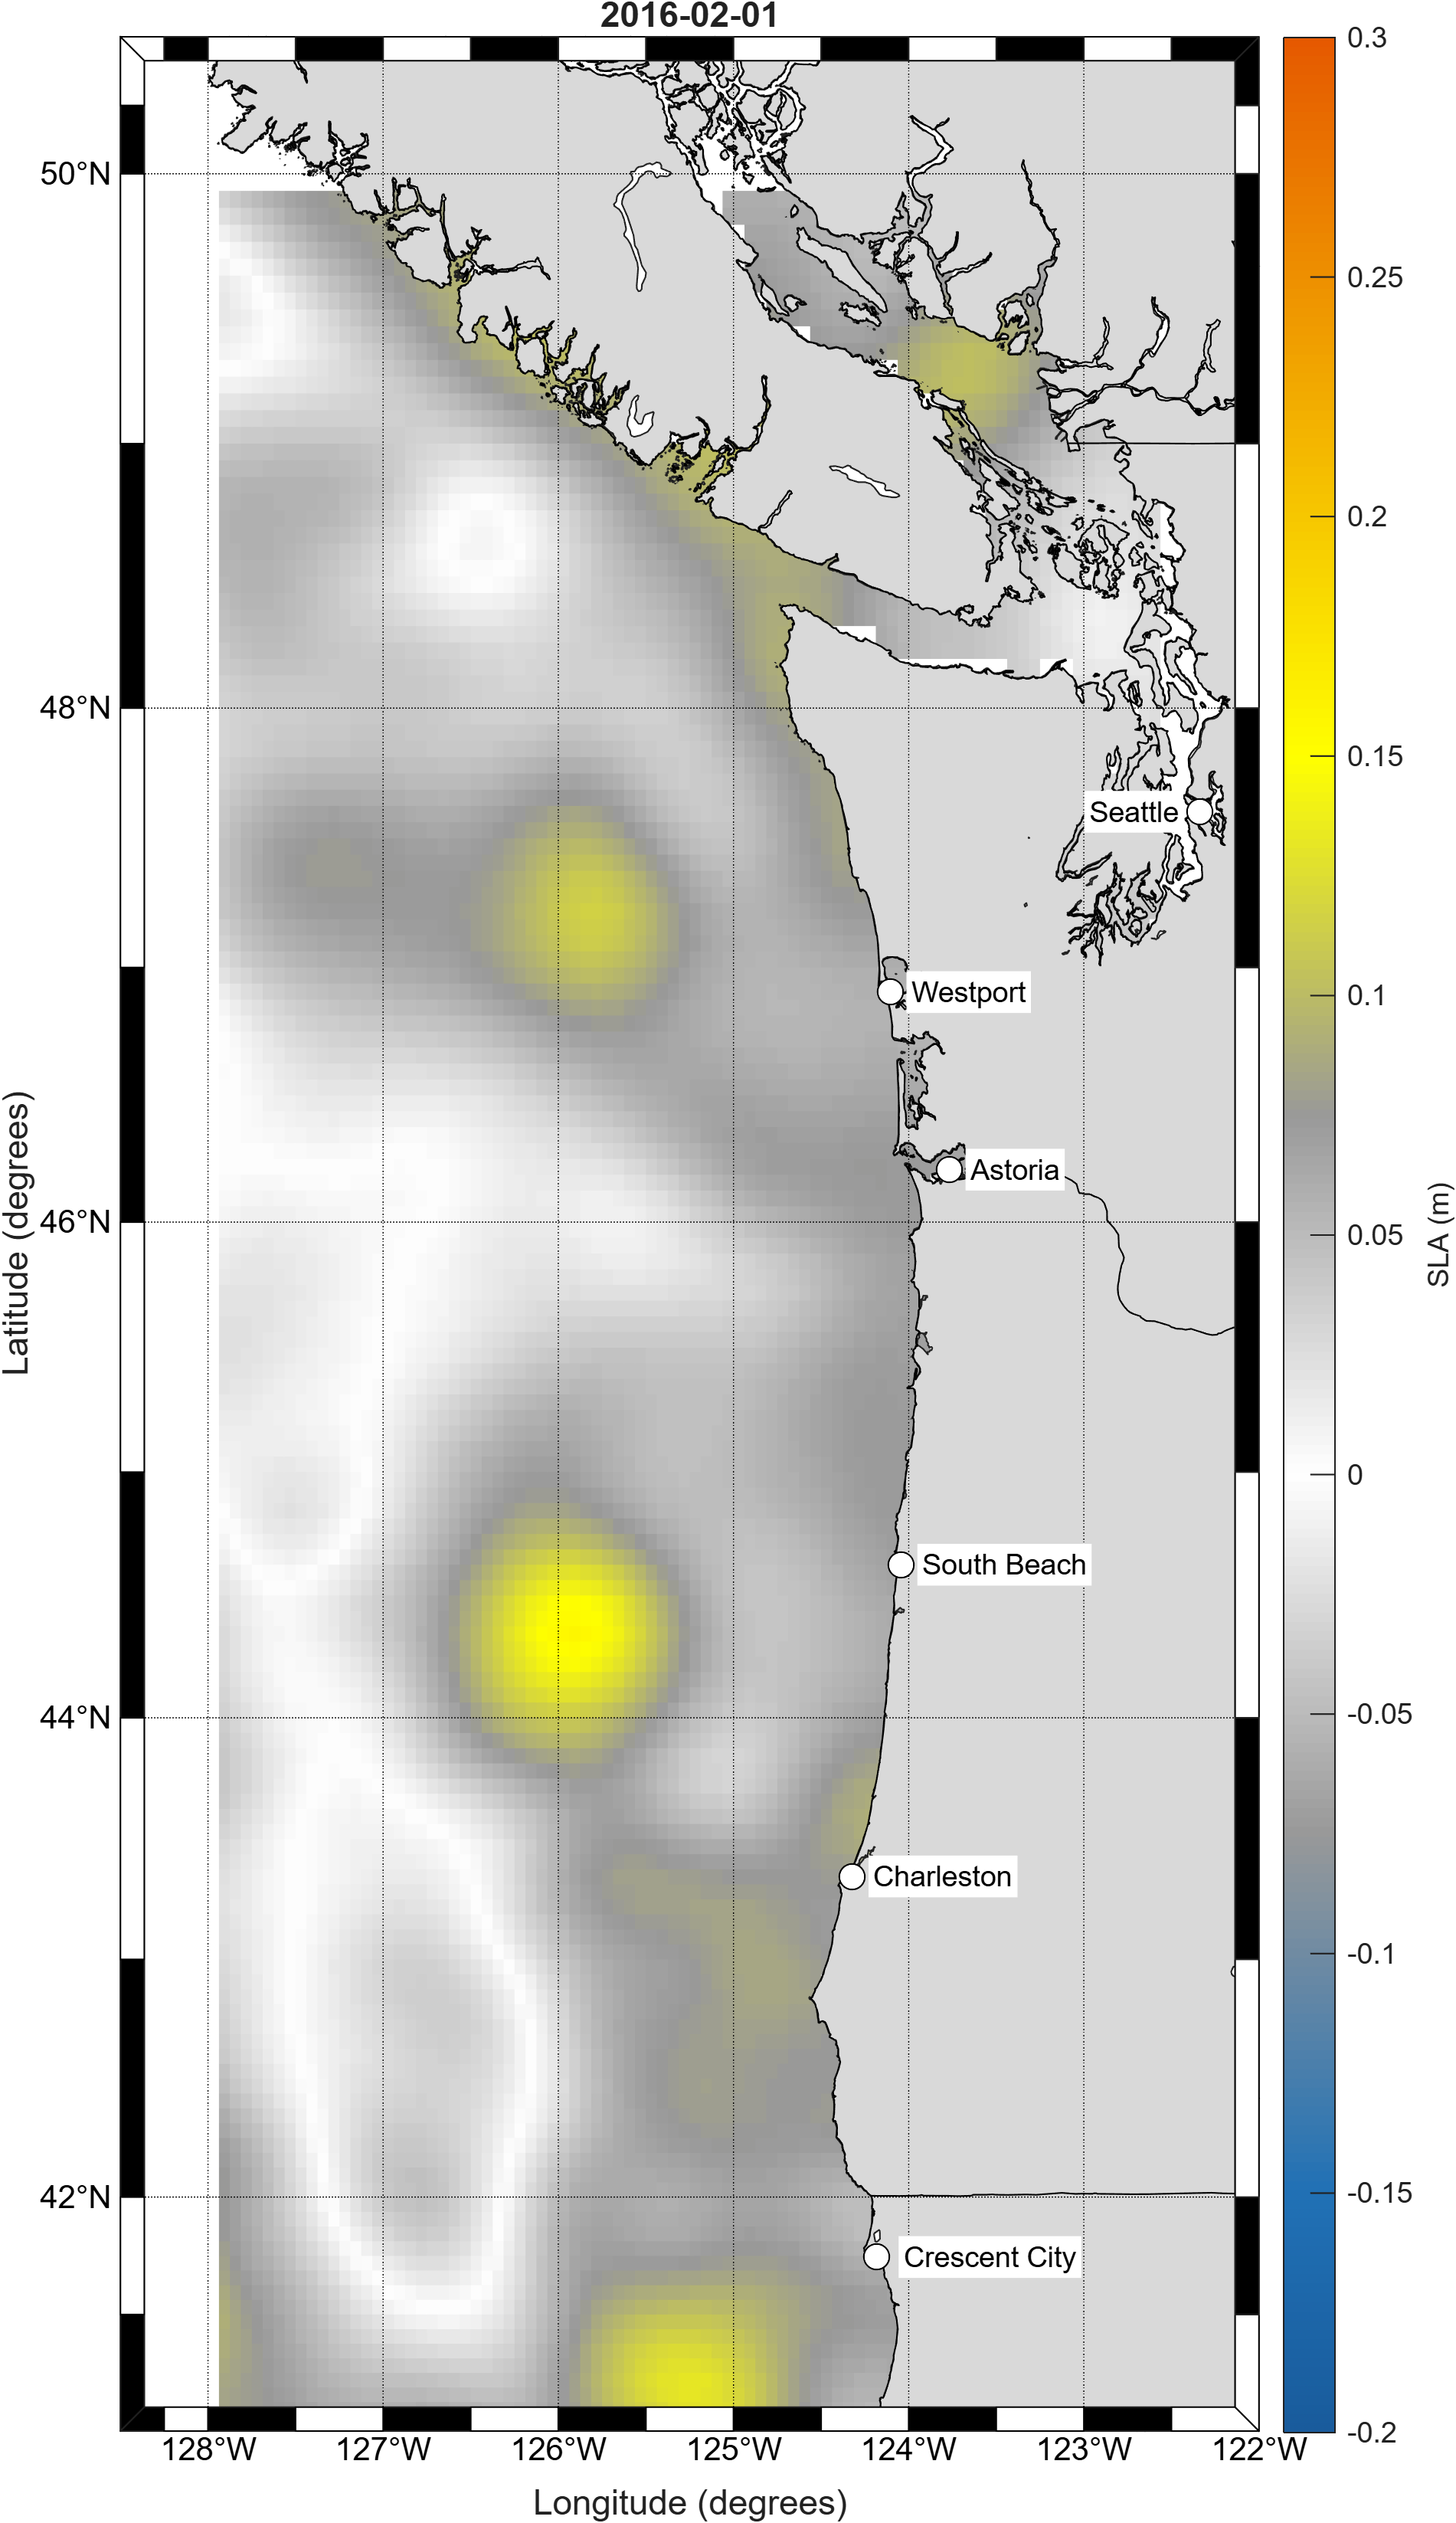
PNW SSH Anomaly Map
February 2016 El Niño
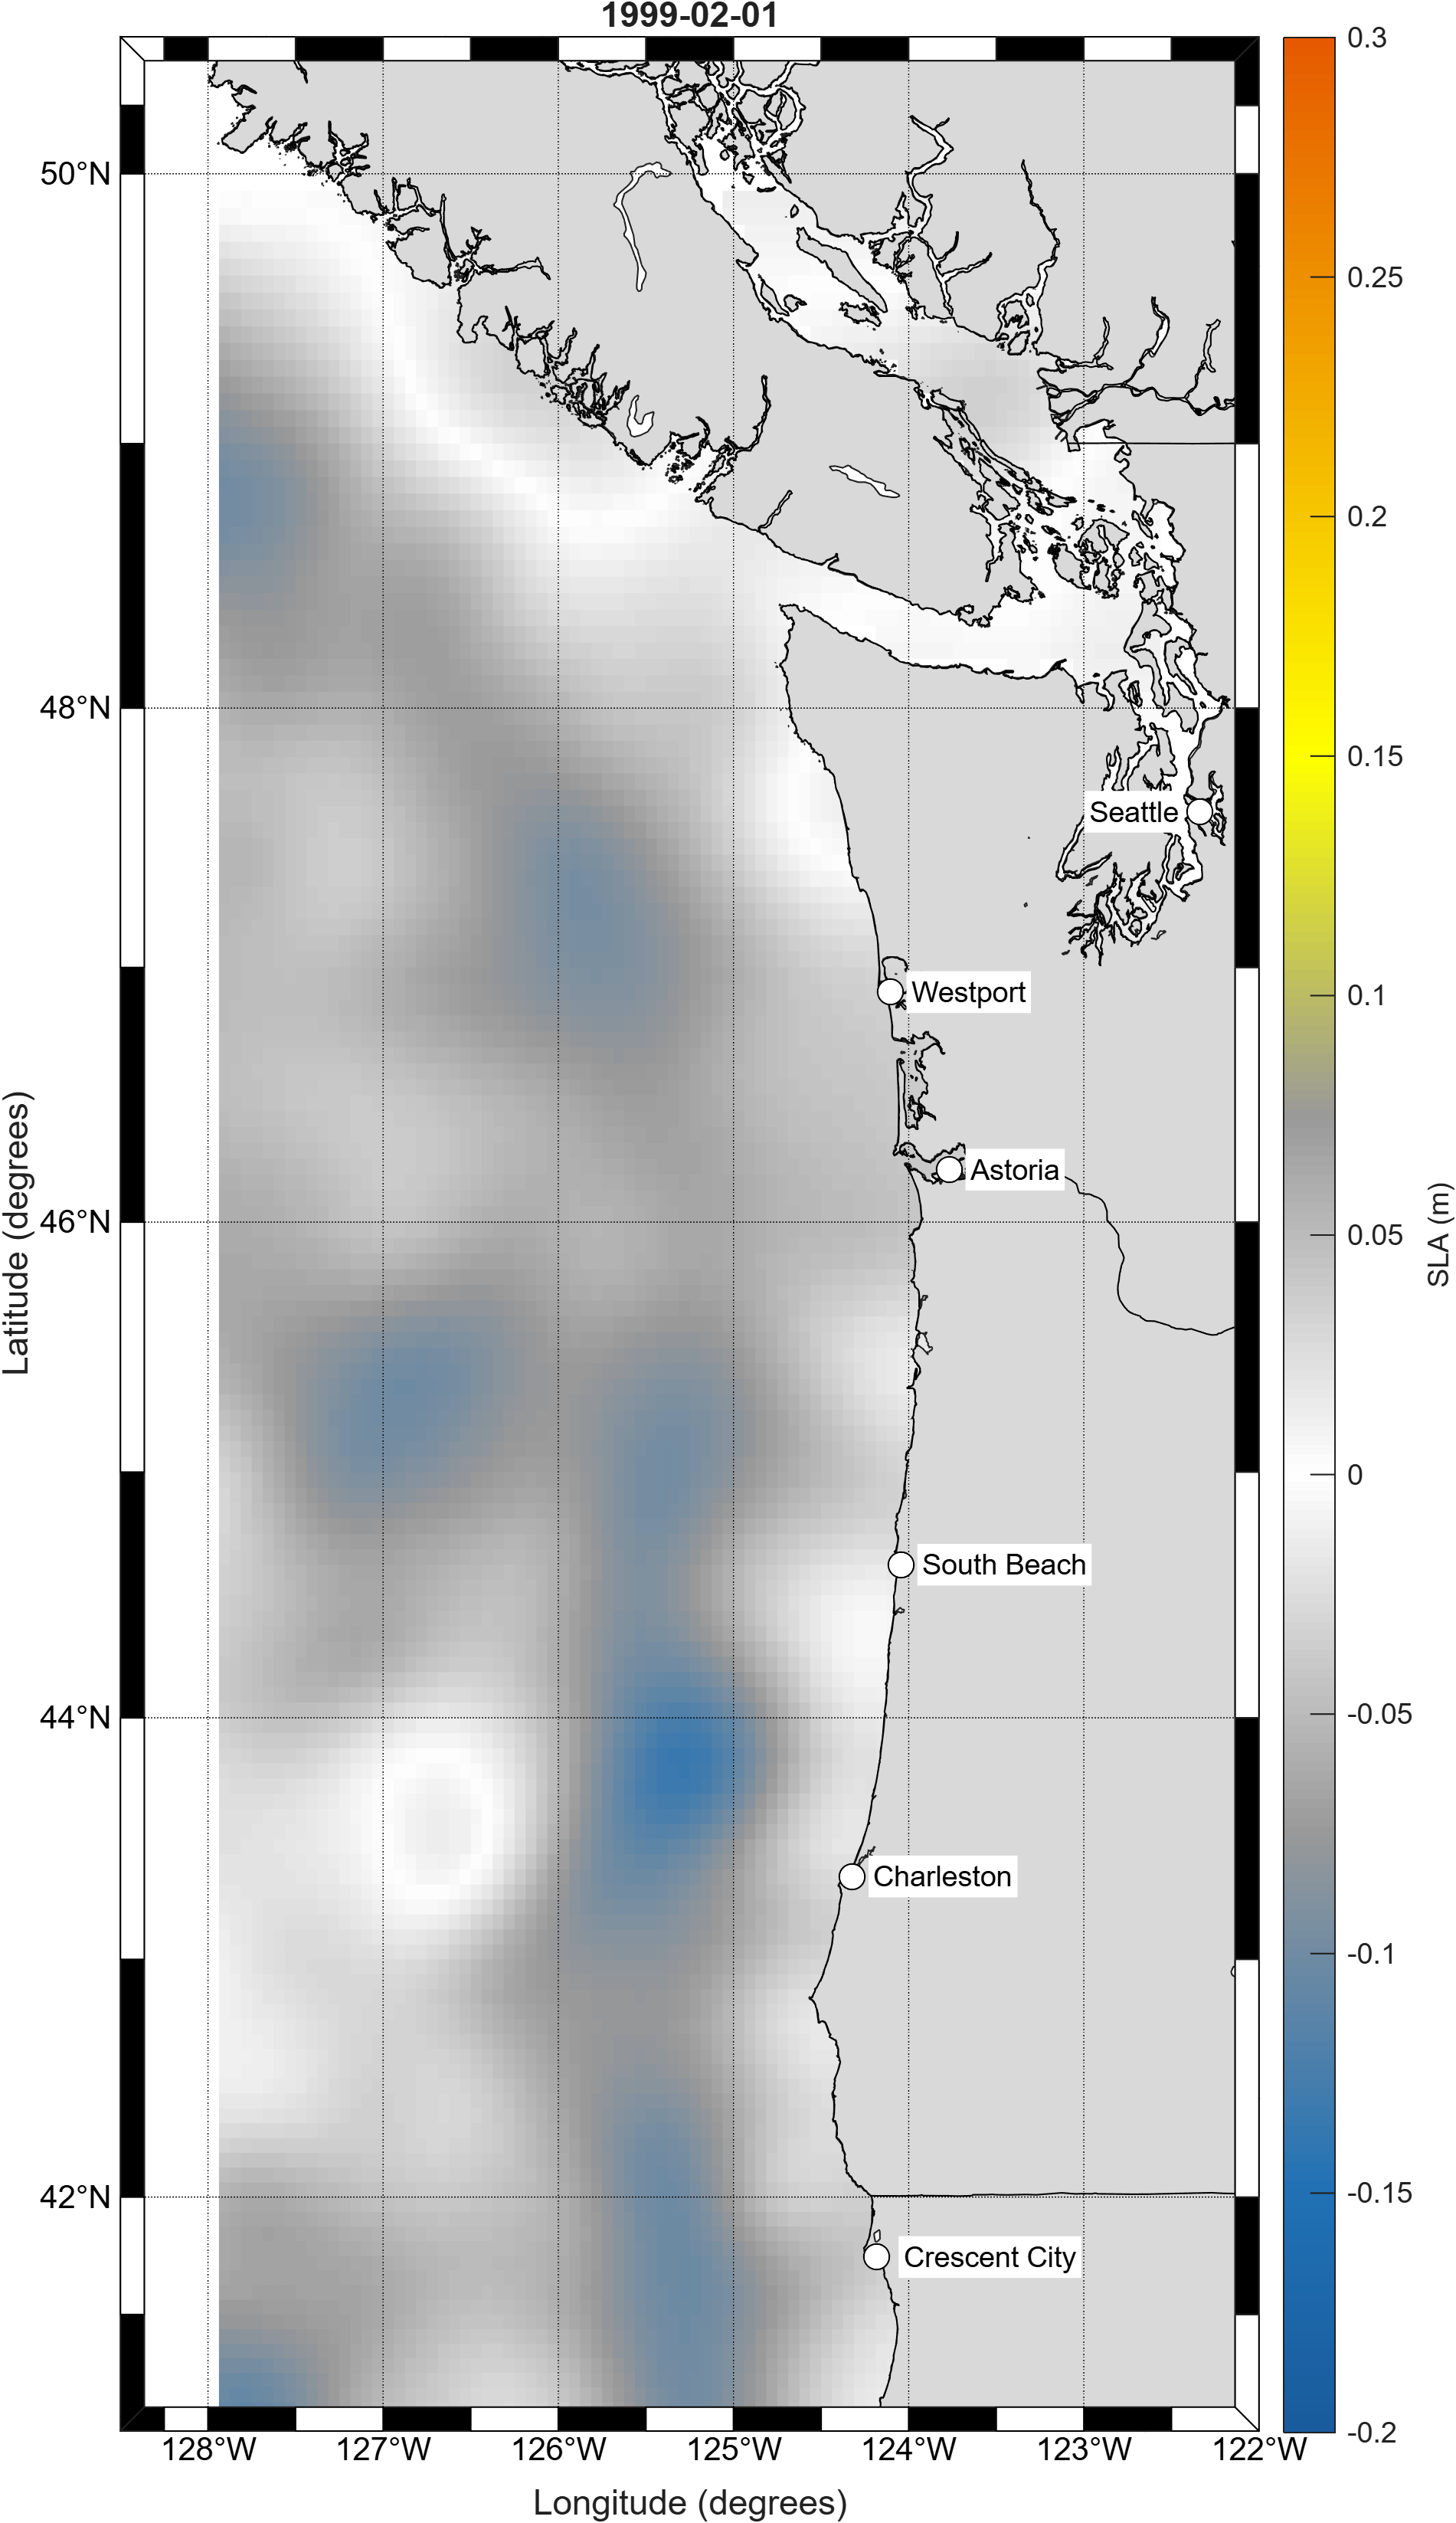
PNW SSH Anomaly Map
February 1999 La Niña
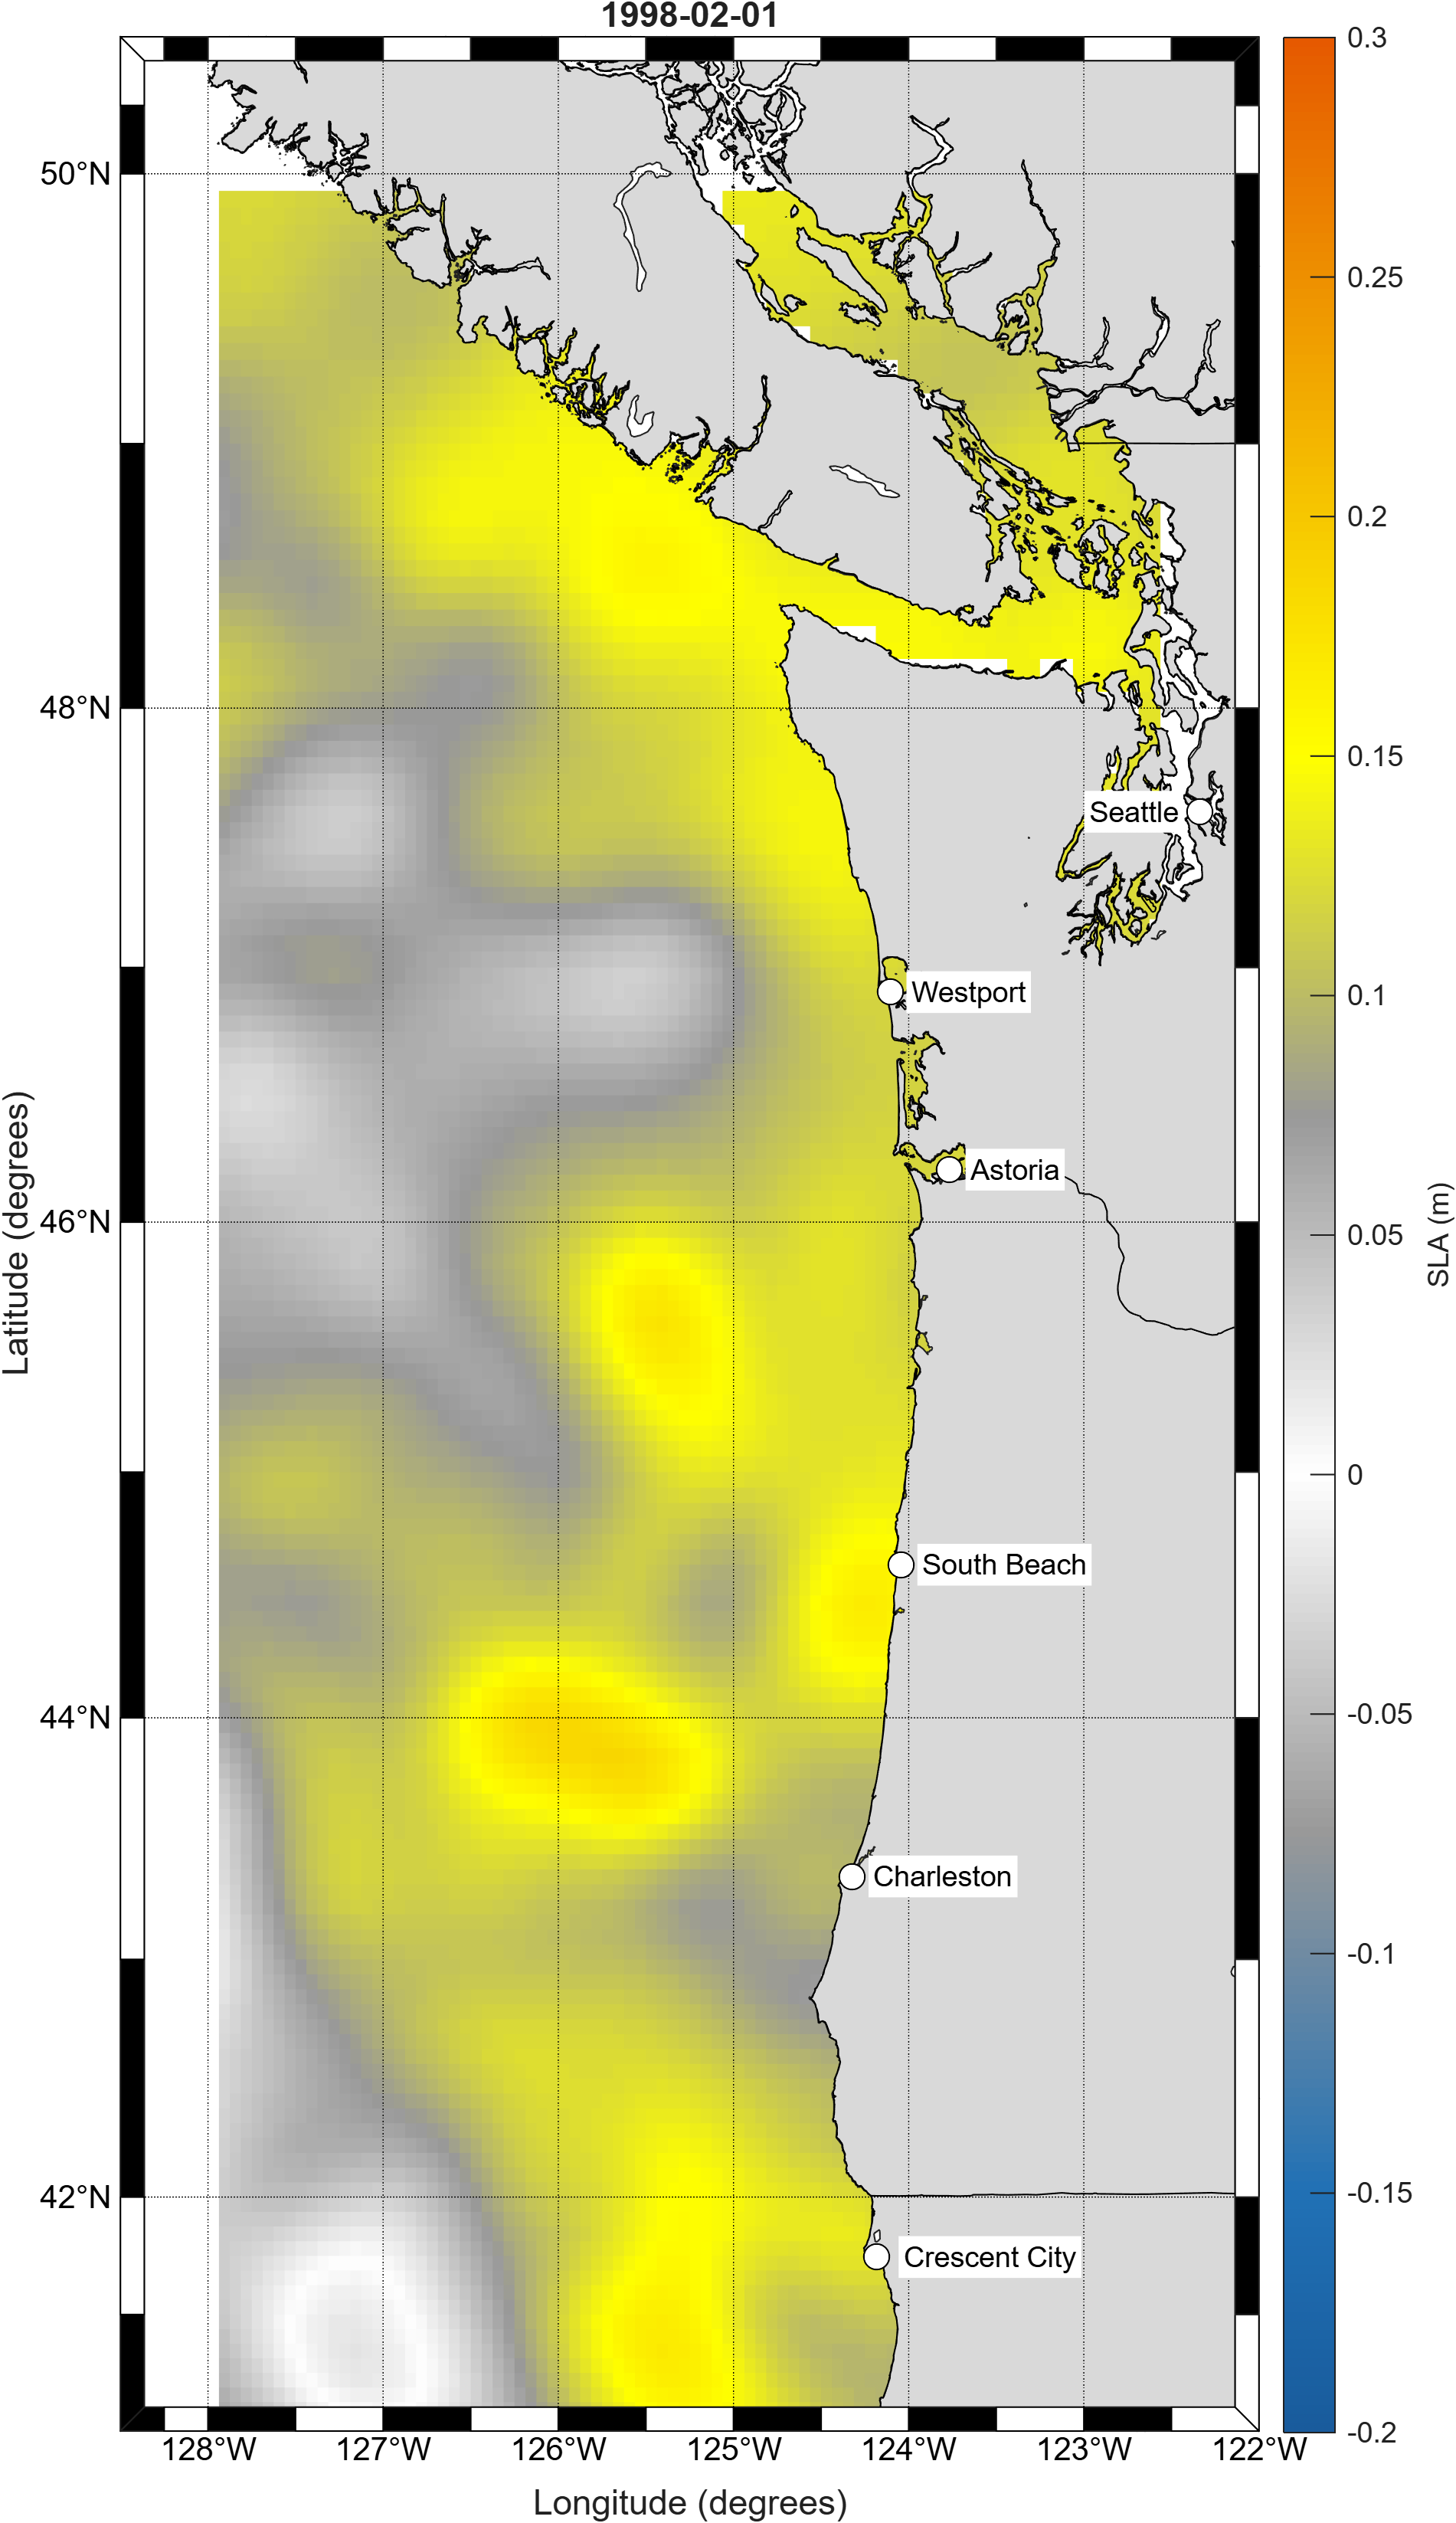
PNW SSH Anomaly Map
February 1998 El Niño
U.S. West Coast
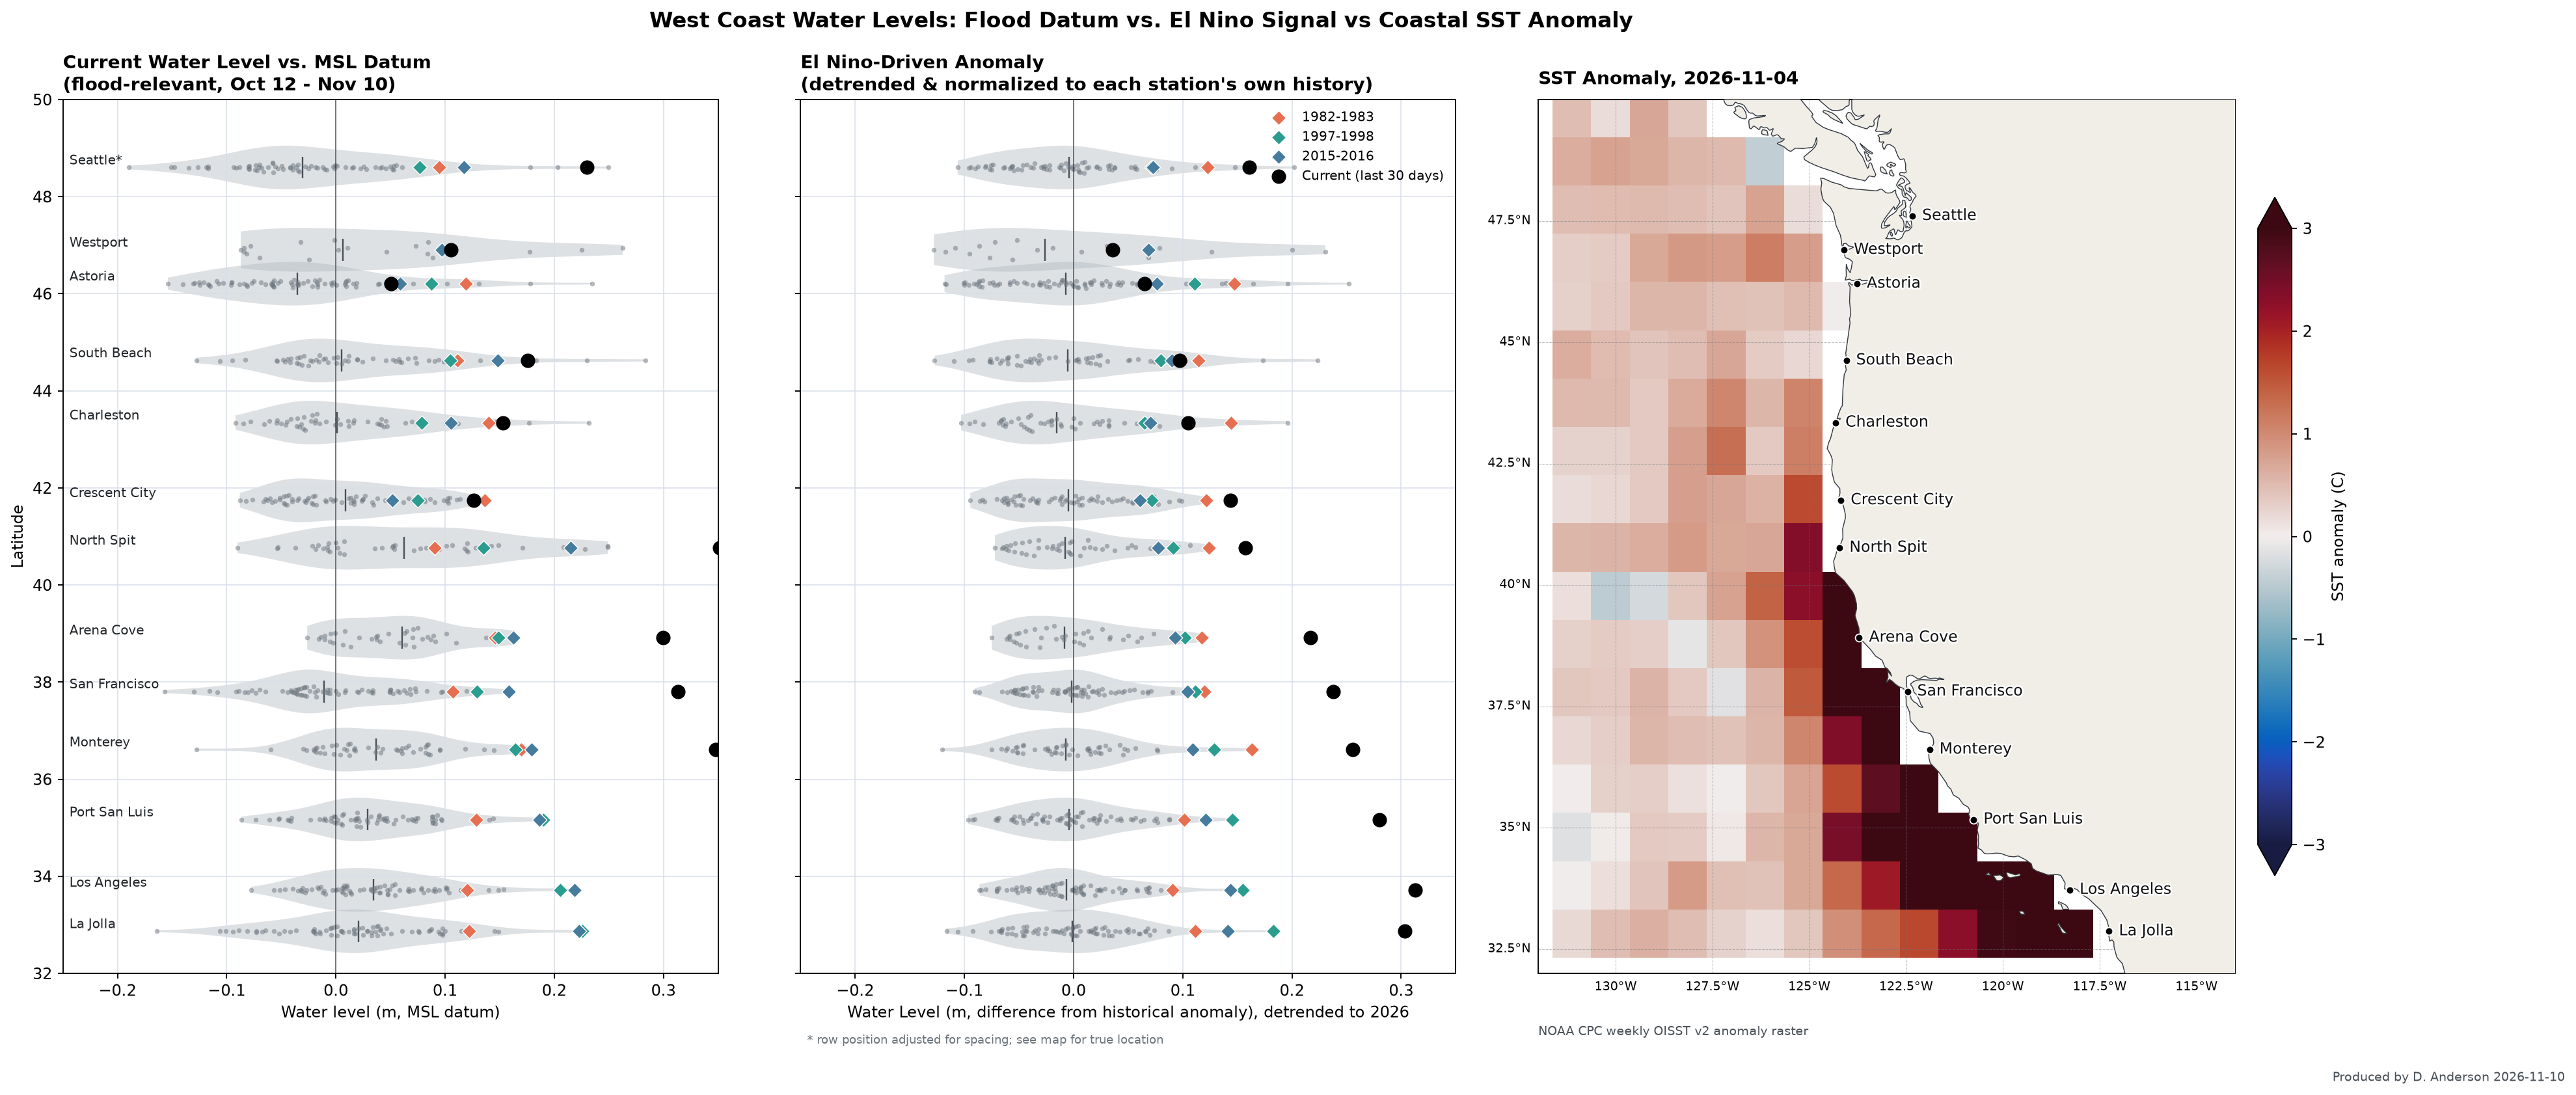
U.S. West Coast Water Levels Violin Plot
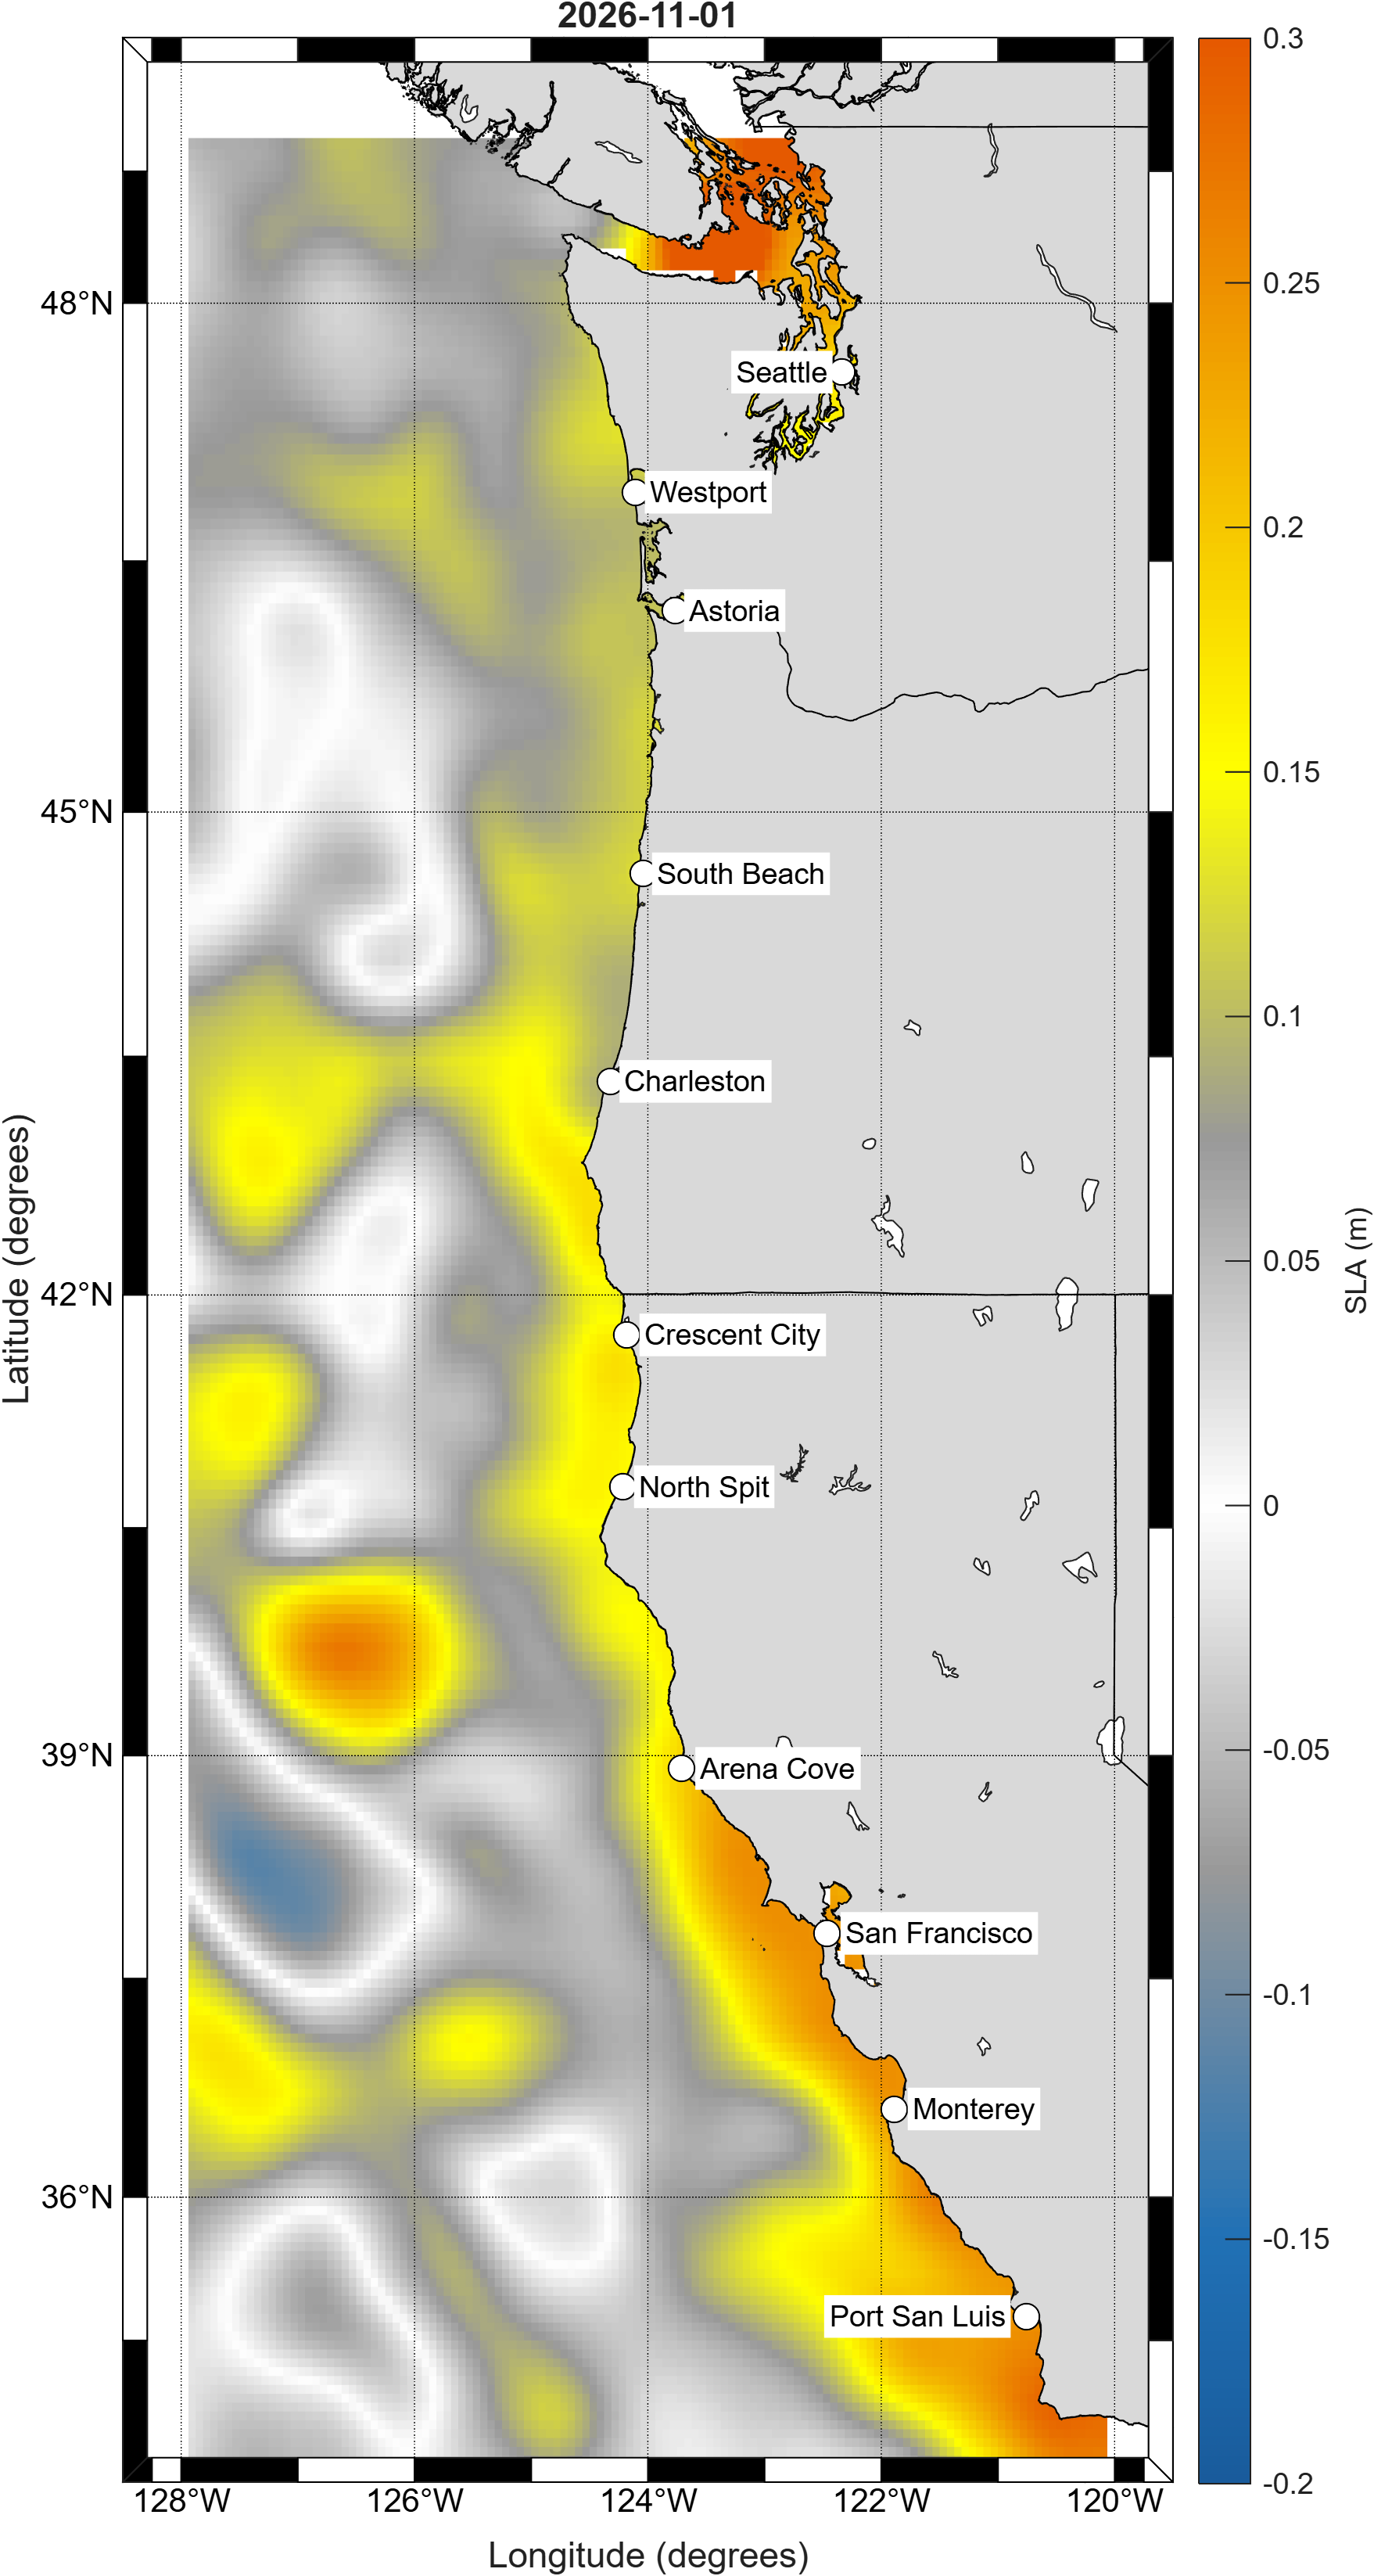
U.S. West Coast SSH Anomaly Map
Latest
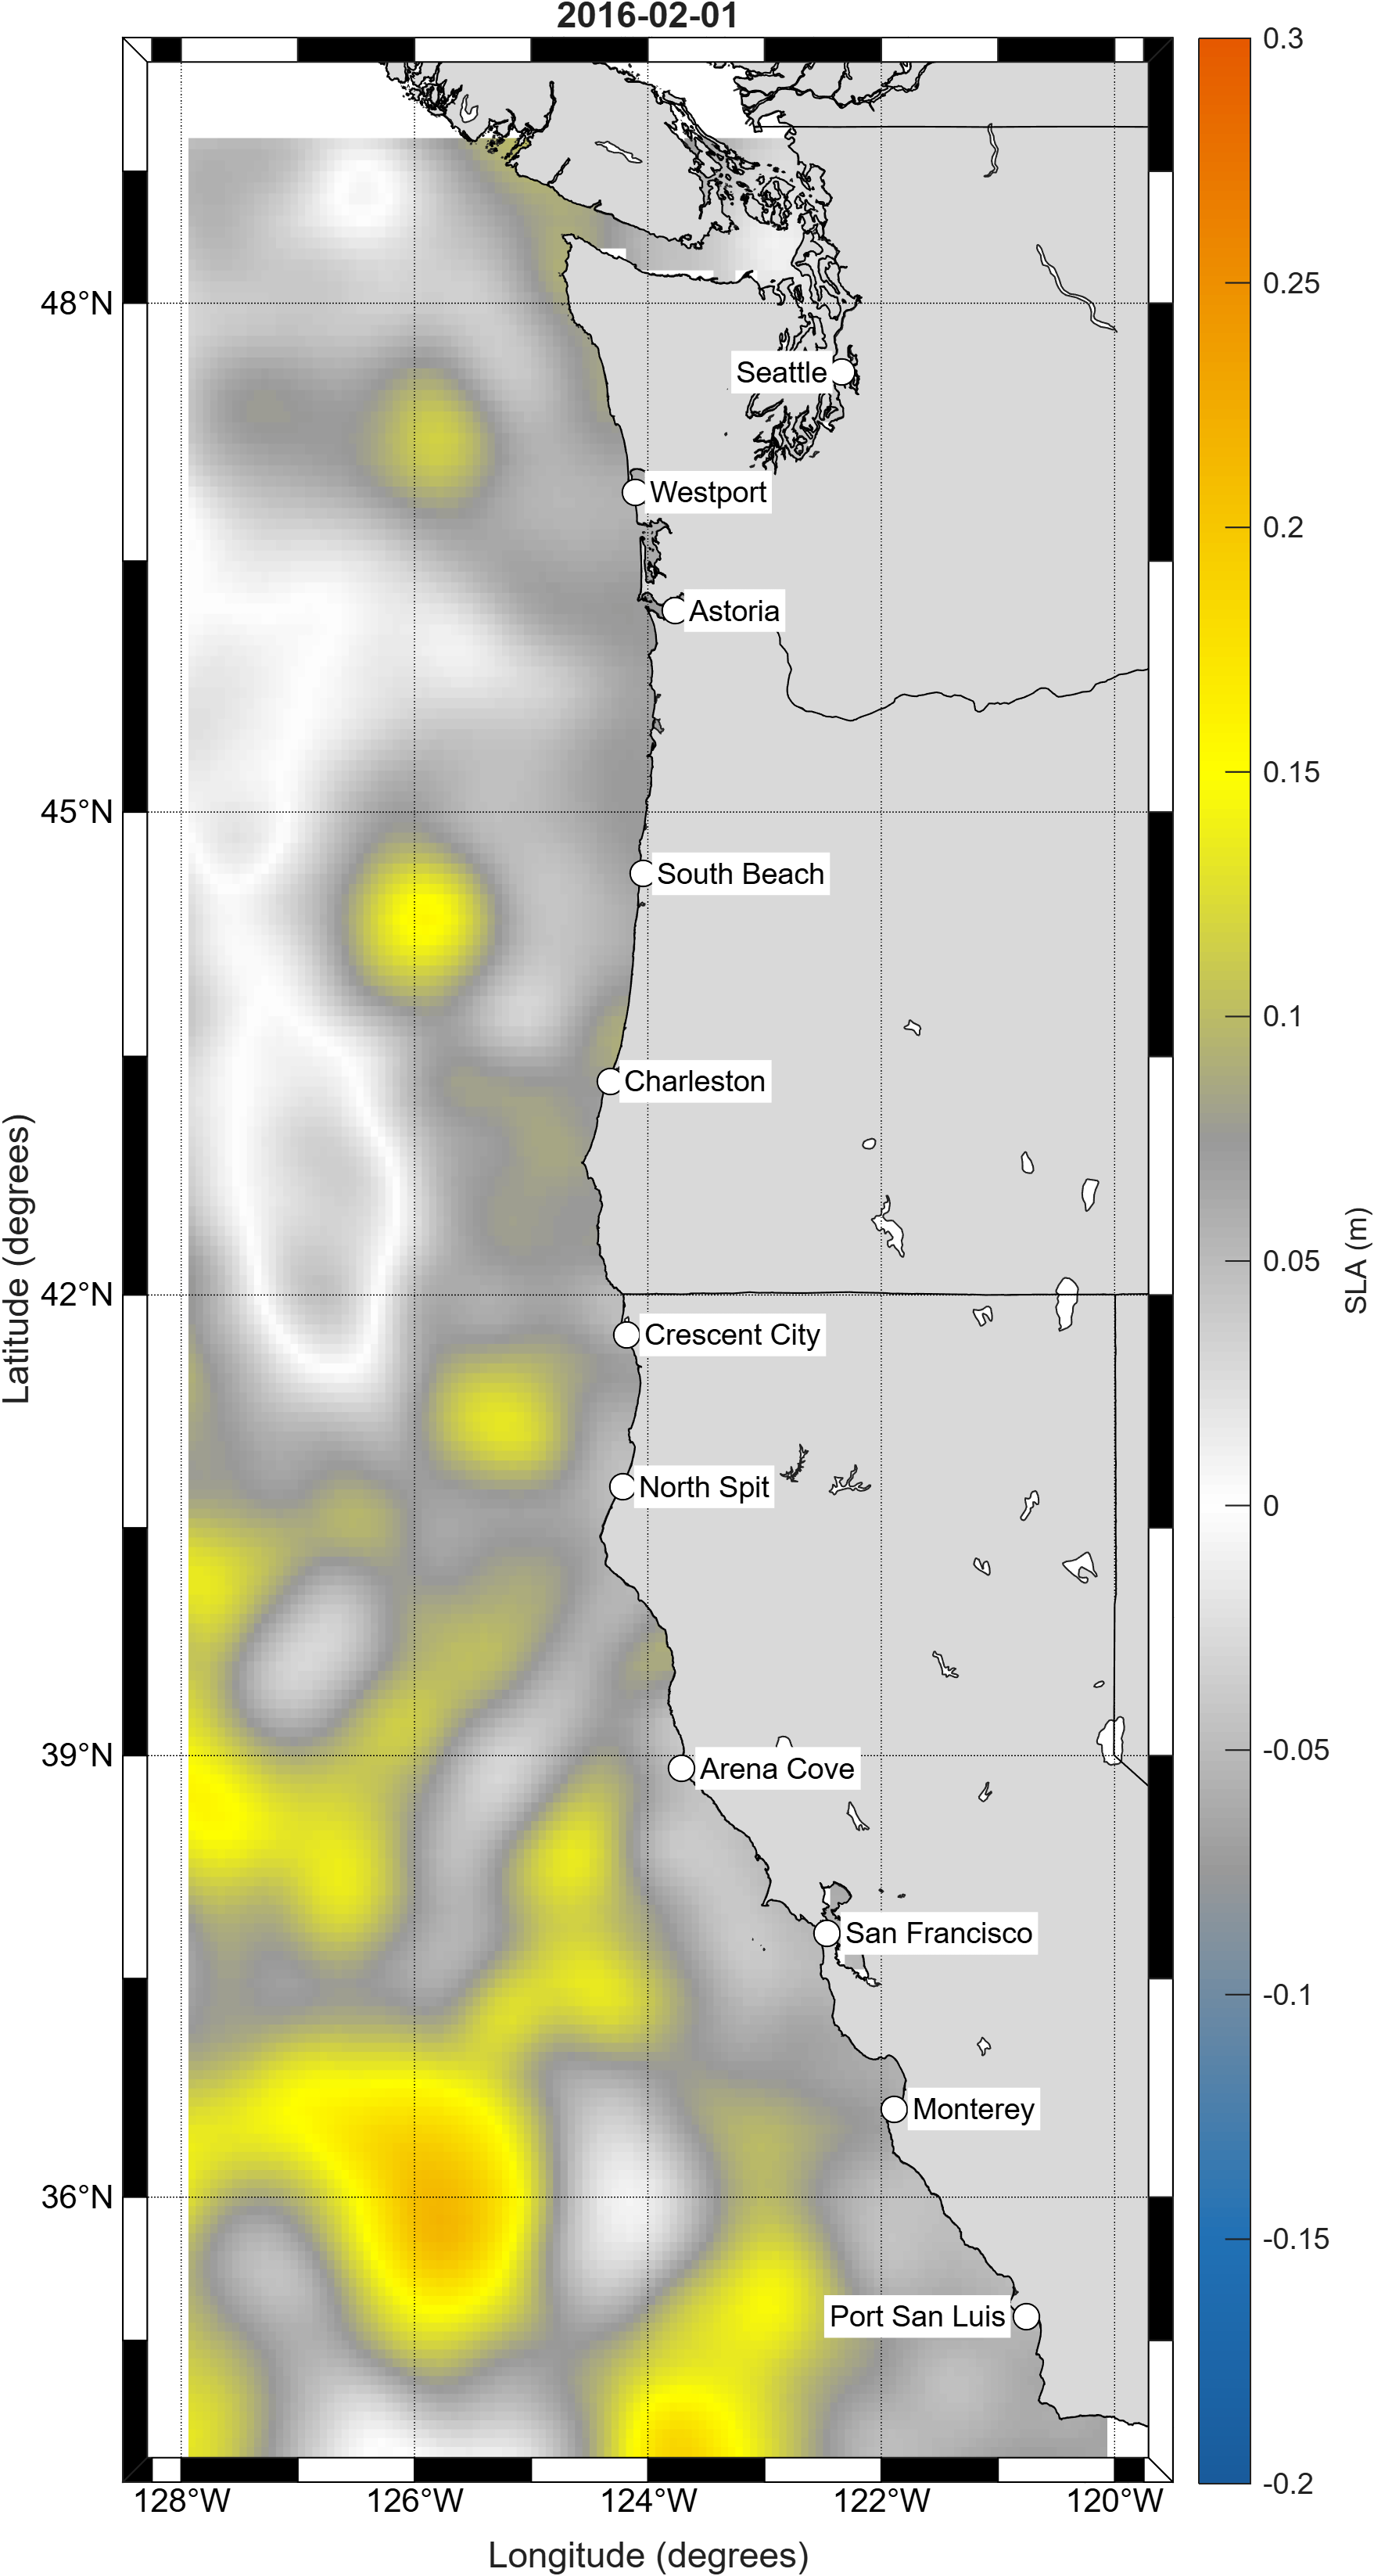
U.S. West Coast SSH Anomaly Map
February 2016 El Niño
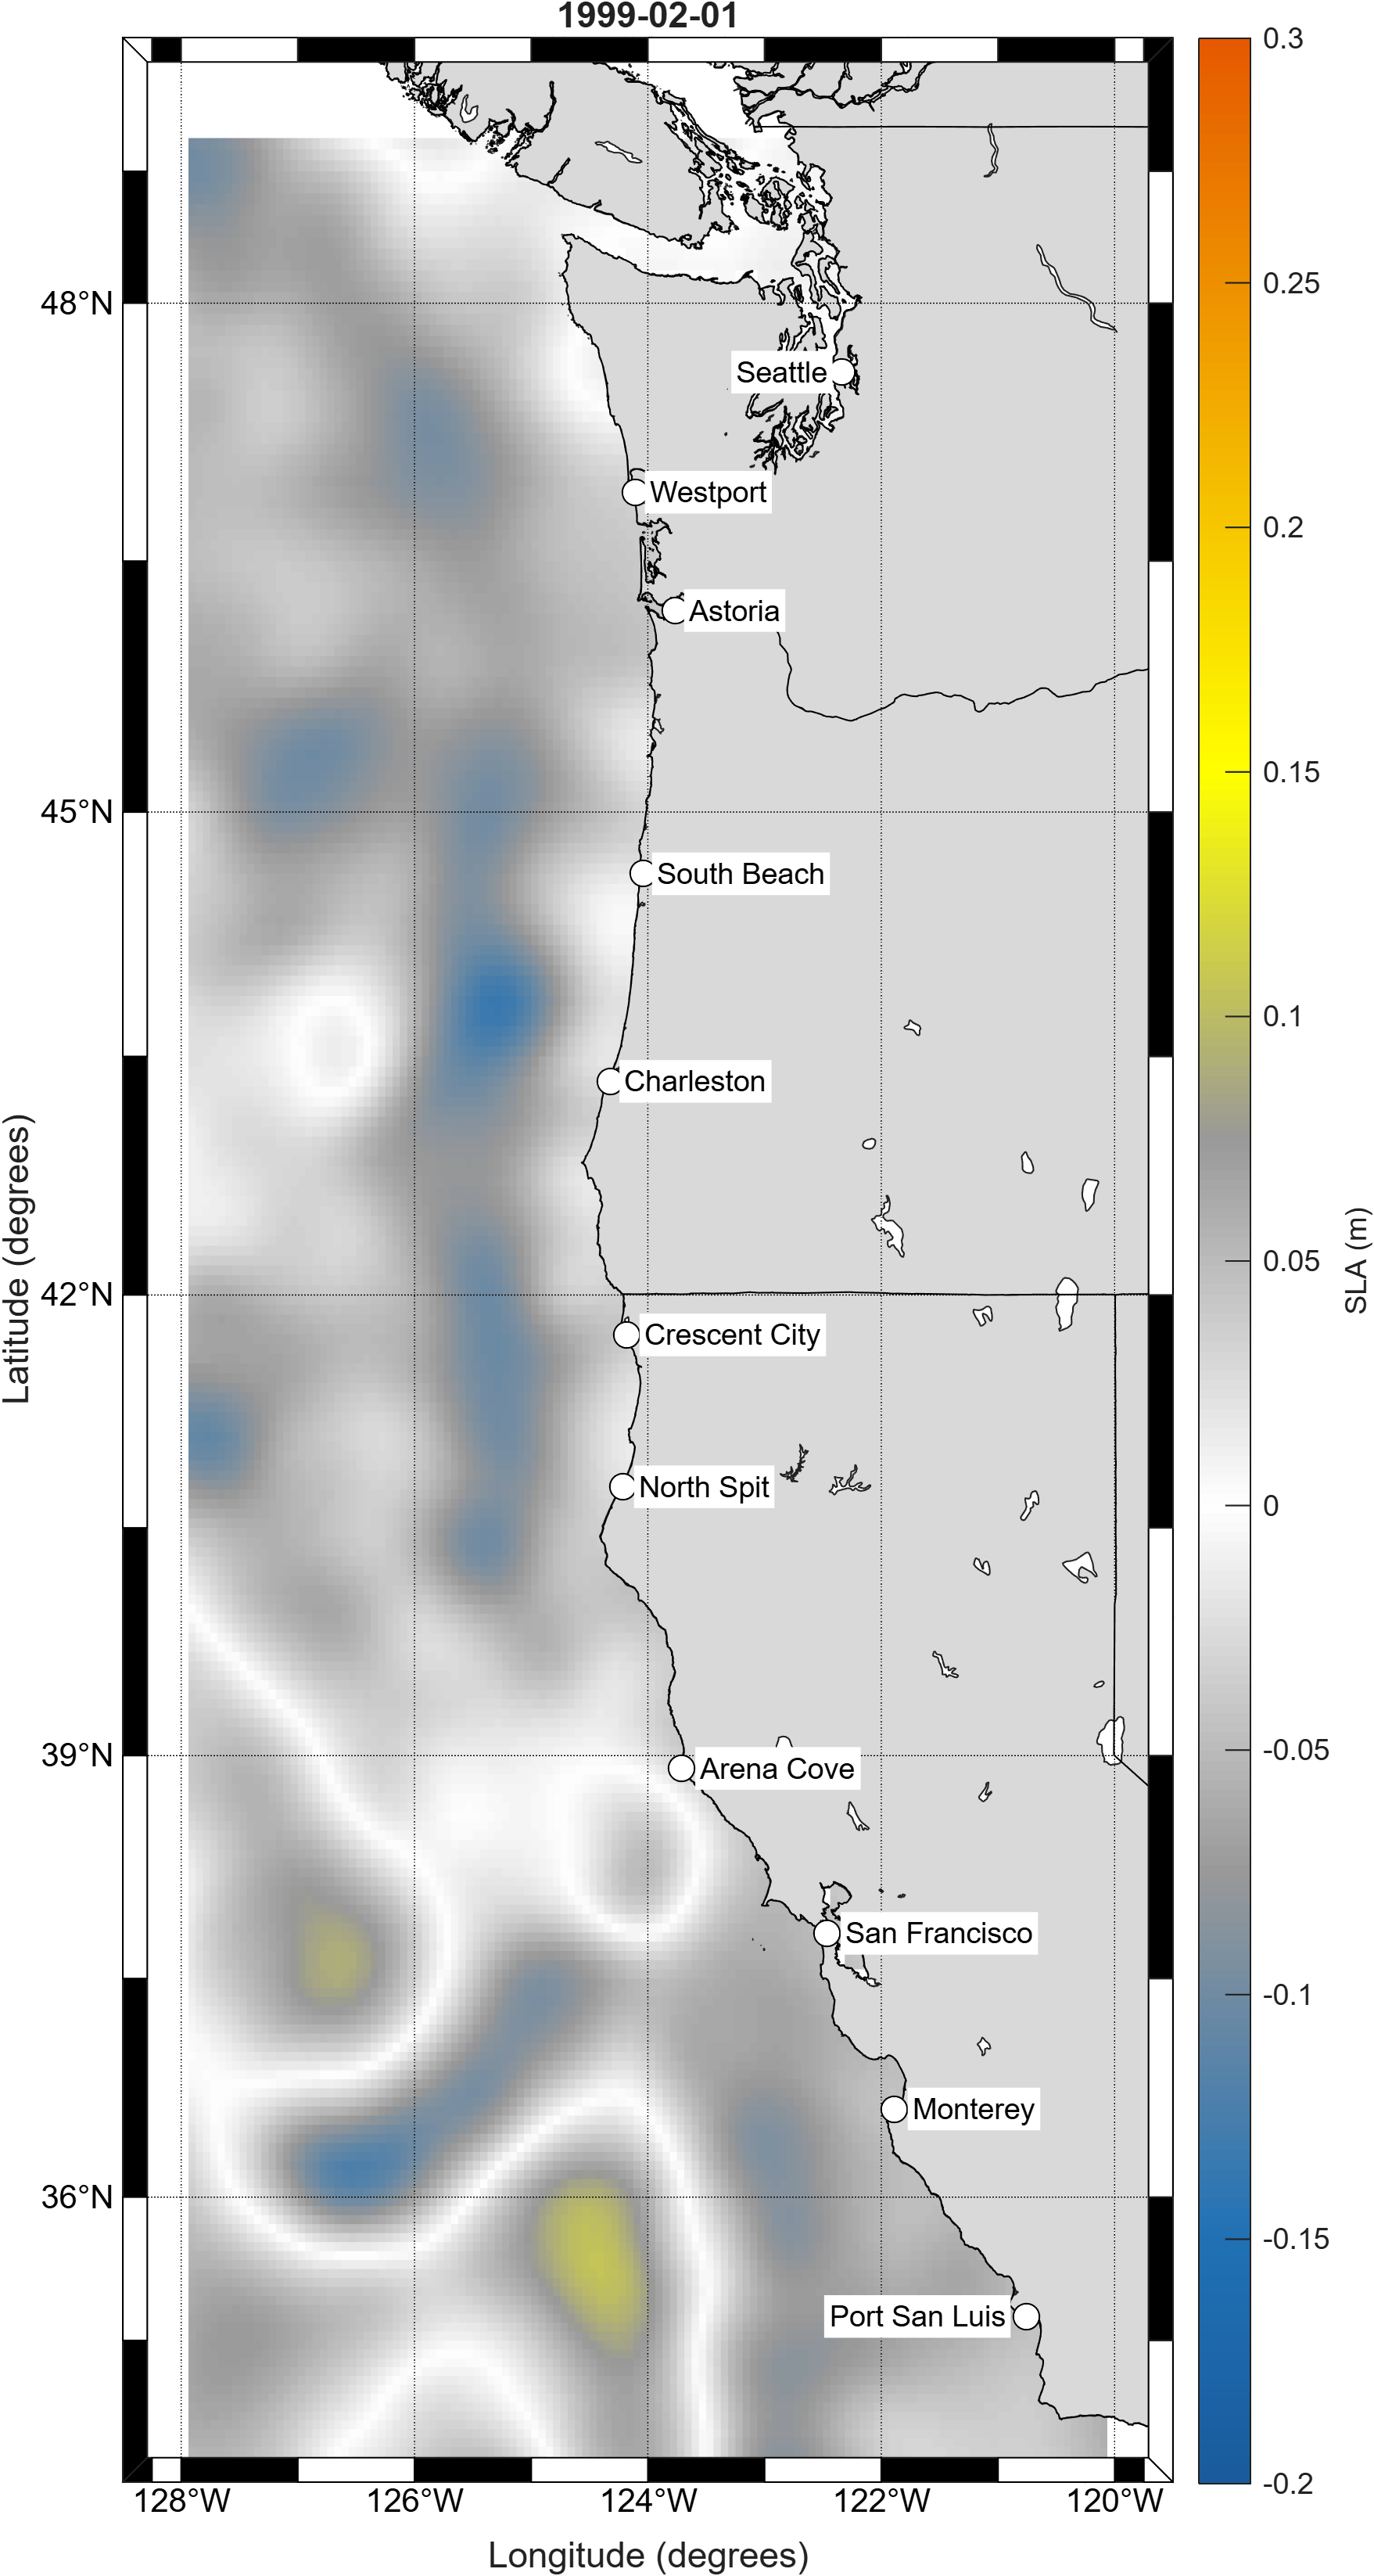
U.S. West Coast SSH Anomaly Map
February 1999 La Niña
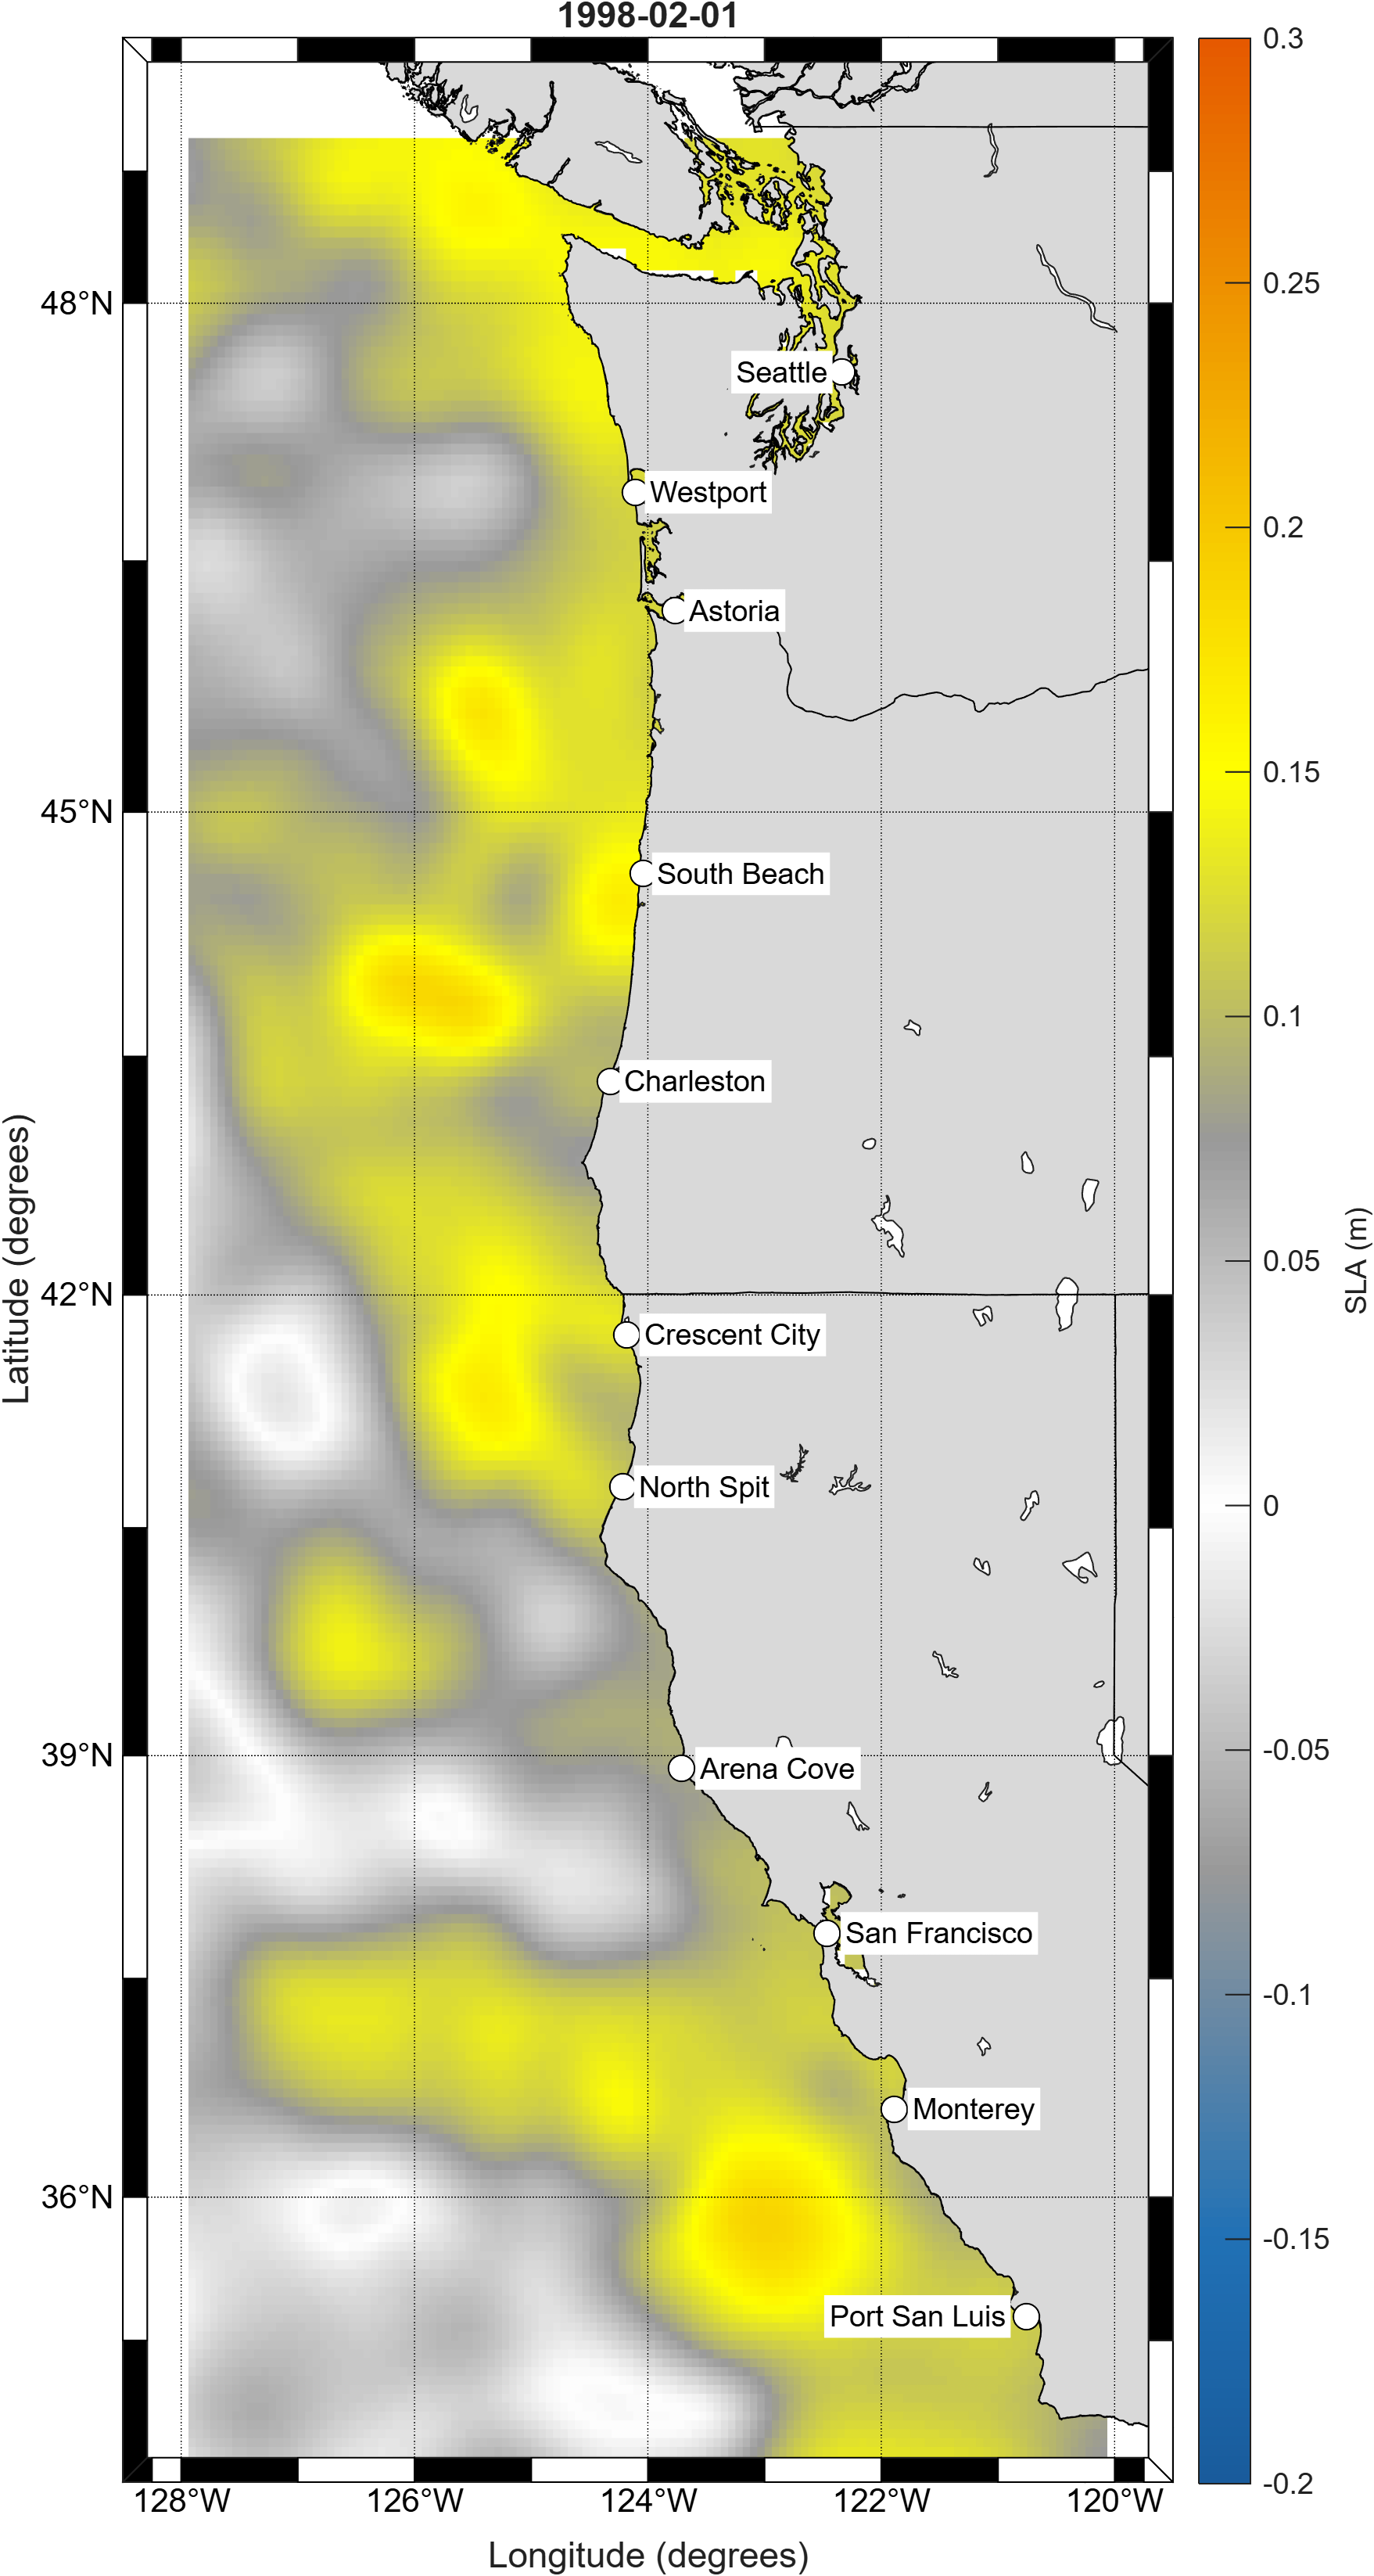
U.S. West Coast SSH Anomaly Map
February 1998 El Niño