

Indicators and Salmon Interactive Tool
To further explore the patterns visible in the stoplight table, the Northwest Fisheries Science Center has developed an interactive tool that allows you to examine specific indicators and their relationship with observed salmon returns at Bonneville Dam. They use a combination of statistical tools to investigate how well different indicators explain variability in adult salmon counts from year to year and how closely model estimates align with observed returns.
The text below provides additional information on the tool and how to interpret the outputs.
Indicators Menu
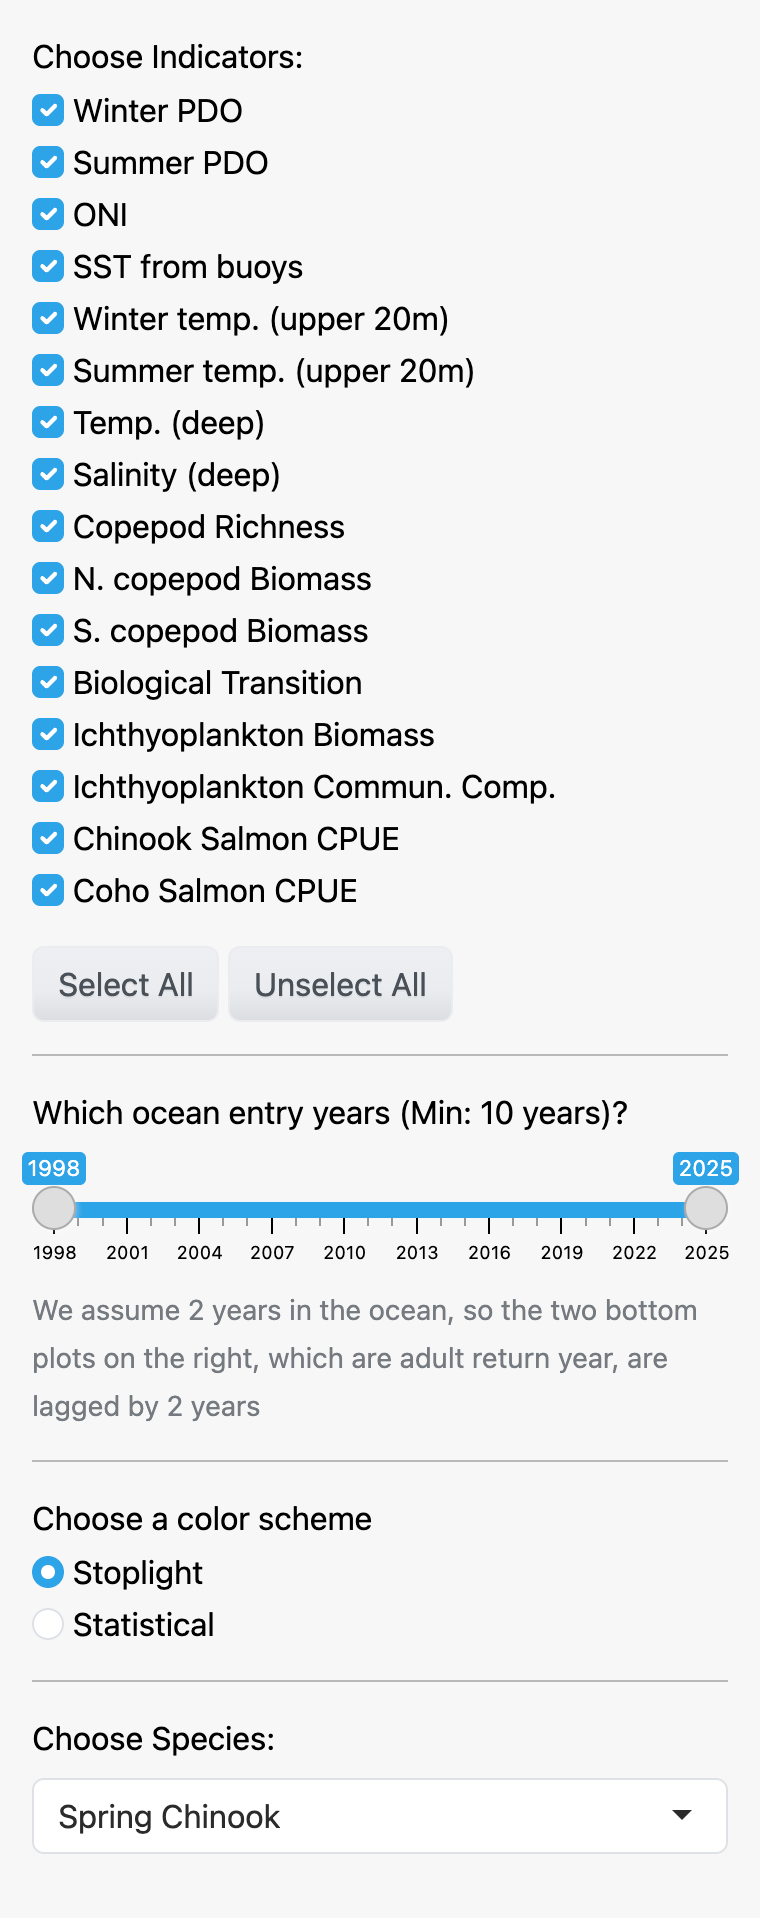
On the left hand side of the webpage, you can select your chosen indicators, which ocean entry years you would like to investigate, and which species of salmon you are interested in.
Stoplight Chart
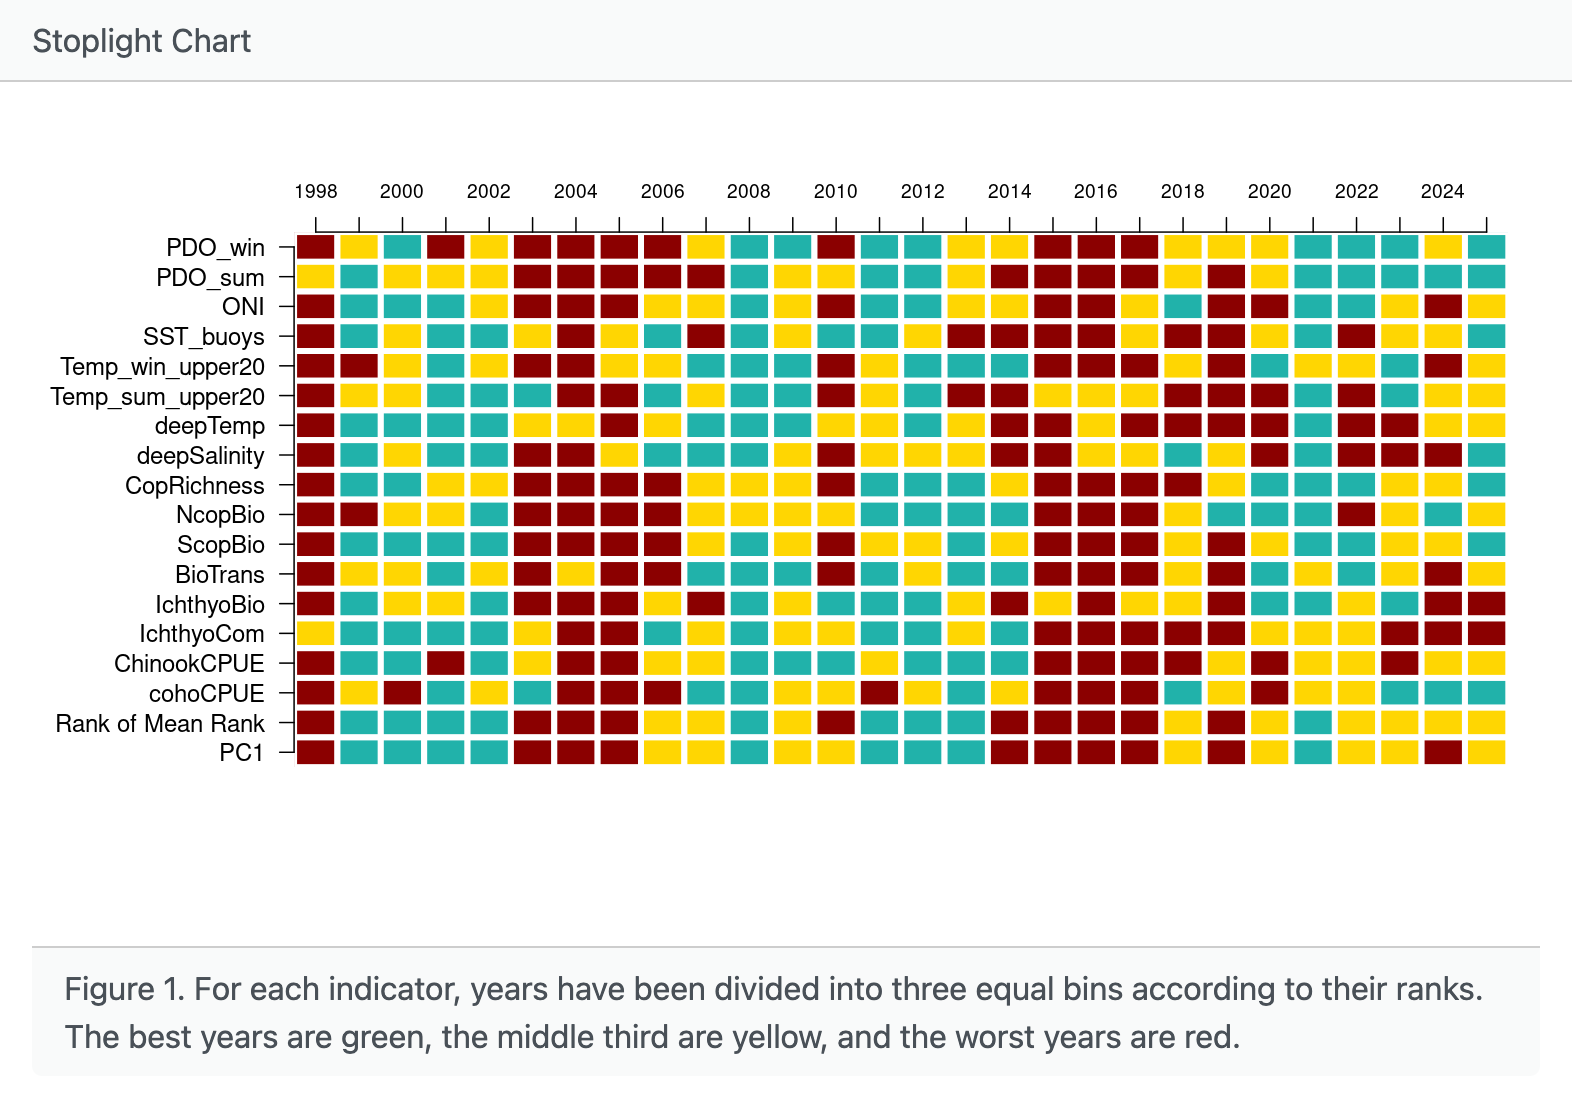
In Figure 1, the tool recreates the stoplight table with your selection of indicators and calculates the means and ranks. Because many of these indicators are correlated with each other, it can be difficult to see the overall signal they contain. To account for this, a single summary measure is created using a statistical technique called a Principal Component Analysis (PCA). Rather than looking at separate indicators, PCA creates one overall score that captures the most important variation among them by finding the main pattern shared across the indicators. This score captures the largest source of variation present across the selected indicators for a given year, which is the First Principal Component (PC1).
To look at the relationship between the selected indicators and the number of adults returned, the PC1 score is then used in a regression model for a period of time (minimum span is ten years). Adult returns are measured using counts of salmon observed at Bonneville Dam.
Generalized Linear Model
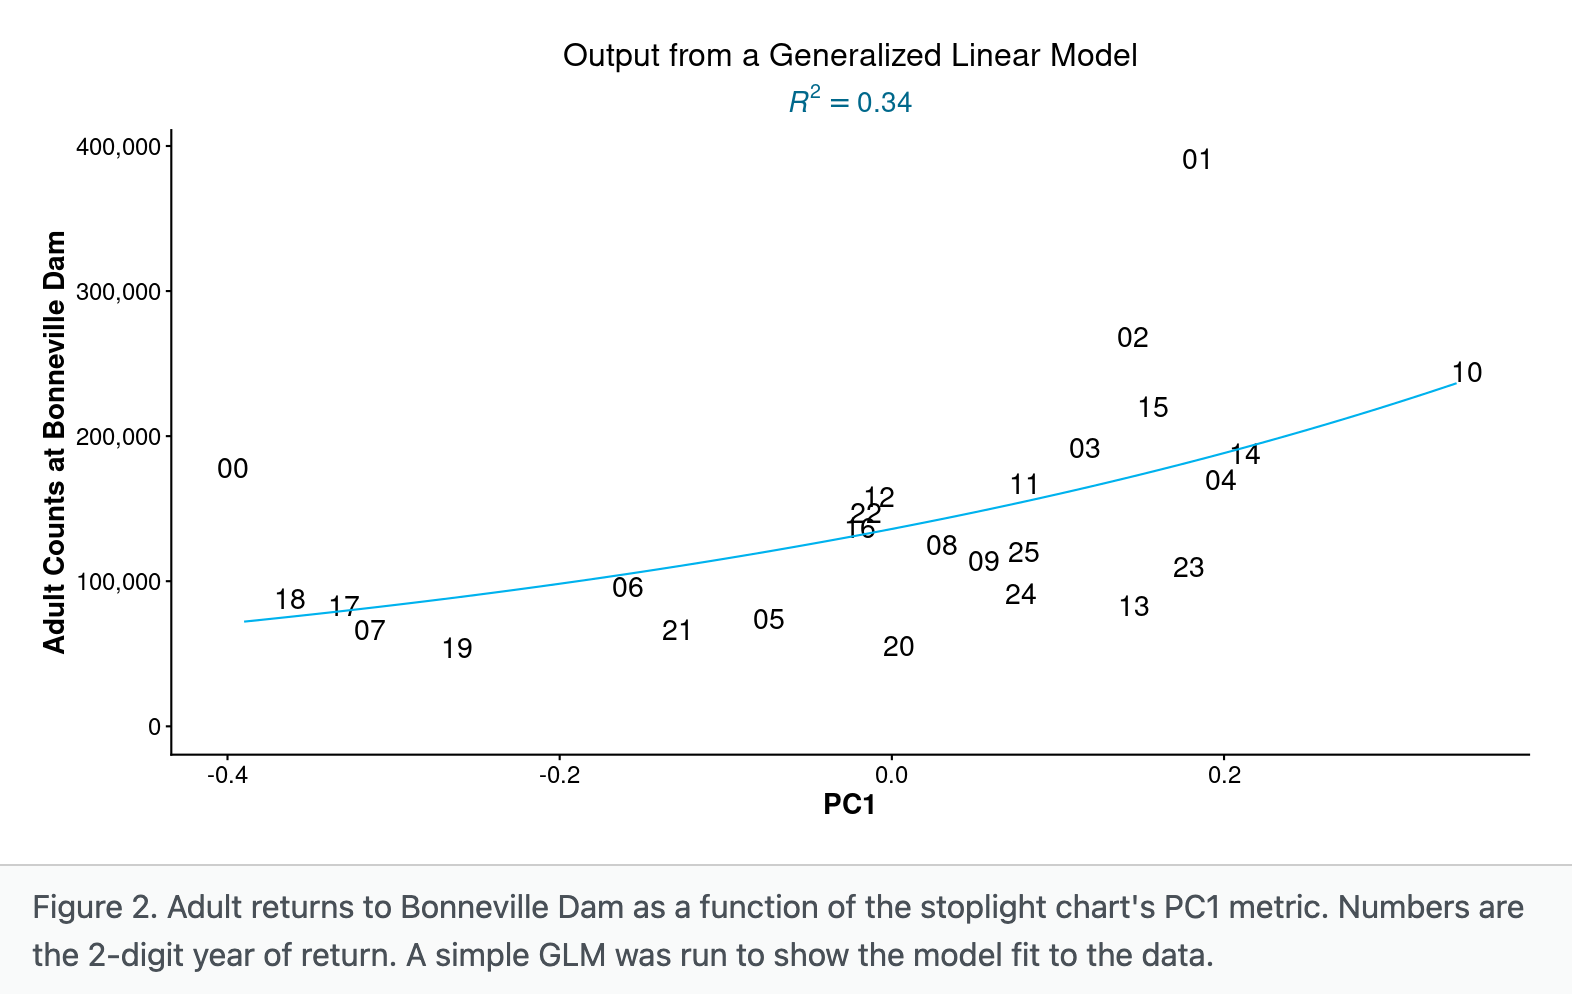
In Figure 2, a generalized linear model (GLM) is used to evaluate how strongly variation in PC1 is associated with variation in adult returns. Generally, a better fit model will explain more of the variability and have a higher R2 value. It is important to remember that a model that explains past data well does not necessarily make accurate predictions for future years. A high model fit indicates that the model describes historical patterns reasonably well, but it does not guarantee that those patterns will continue, or that future forecasts will be highly accurate.
A high model fit indicates that the model describes historical patterns reasonably well, but it does not guarantee that those patterns will continue, or that future forecasts will be highly accurate.
Dynamic Linear Model
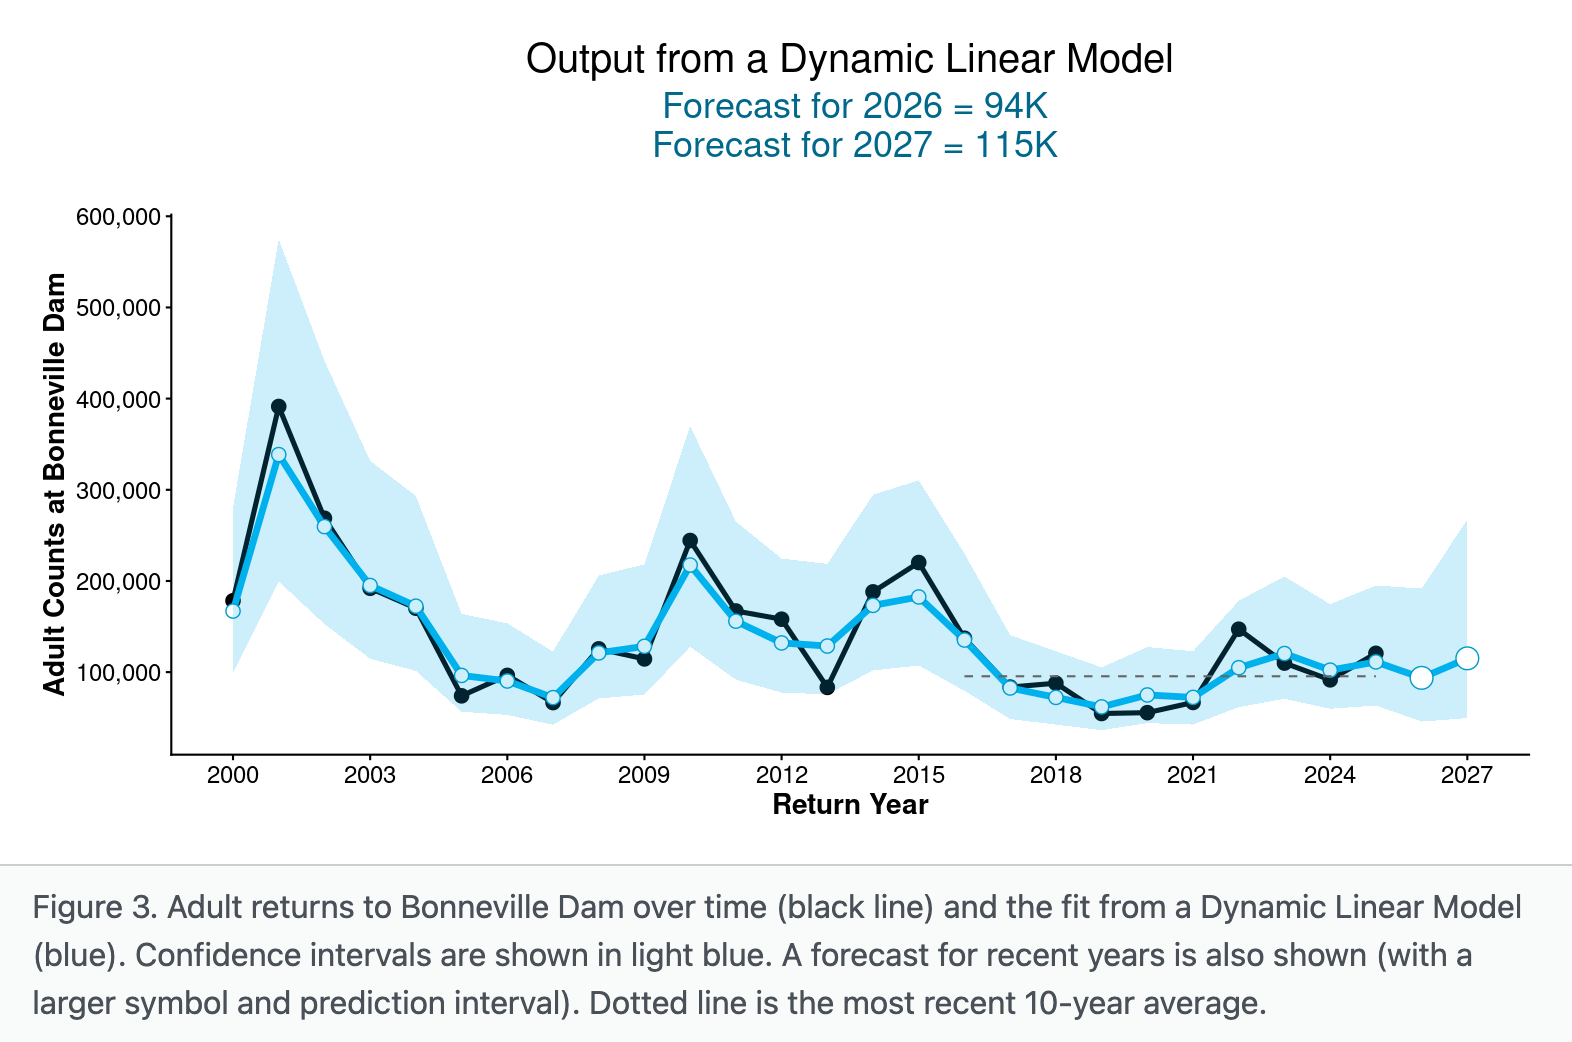
The final plot (Figure 3) shows how well a Dynamic Linear Model (DLM) of the variables and timestamp you selected (blue line) match the observed adult salmon returns (black line) and makes a forecast for an additional two years. Unlike the first regression, which assumes the relationship between environmental conditions and adult returns remains the same every year, the DLM allows that relationship to change over time.
Instead of estimating one fixed slope, it estimates a slope that can change slightly from year to year, allowing the model to adapt as conditions change. Because future biological systems are inherently uncertain, the forecast should be viewed as an estimate of likely outcomes rather than accurate predictions.