Forecast Origin Dates
Overview
The J-SCOPE forecast system for Washington and Oregon coastal waters presents preliminary results for the ocean acidification conditions during the 2023 upwelling season. The forecast for 2023 is composed of three model runs that make up an ensemble. Each model run is initialized at a different time (January 5, January 15, January 25), and has complementary forcing files from the large scale model, CFS.
The forecasts simulate conditions in 2023. The pH and Ω fields are calculated using CO2SYS (Pelletier et al., 2007), based on modeled dissolved inorganic carbon (DIC) and total alkalinity (TA). This work is part of a collaboration between Samantha Siedlecki, J-SCOPE, and the Ocean Acidification group at NOAA Pacific Marine Environmental Laboratory (PMEL).
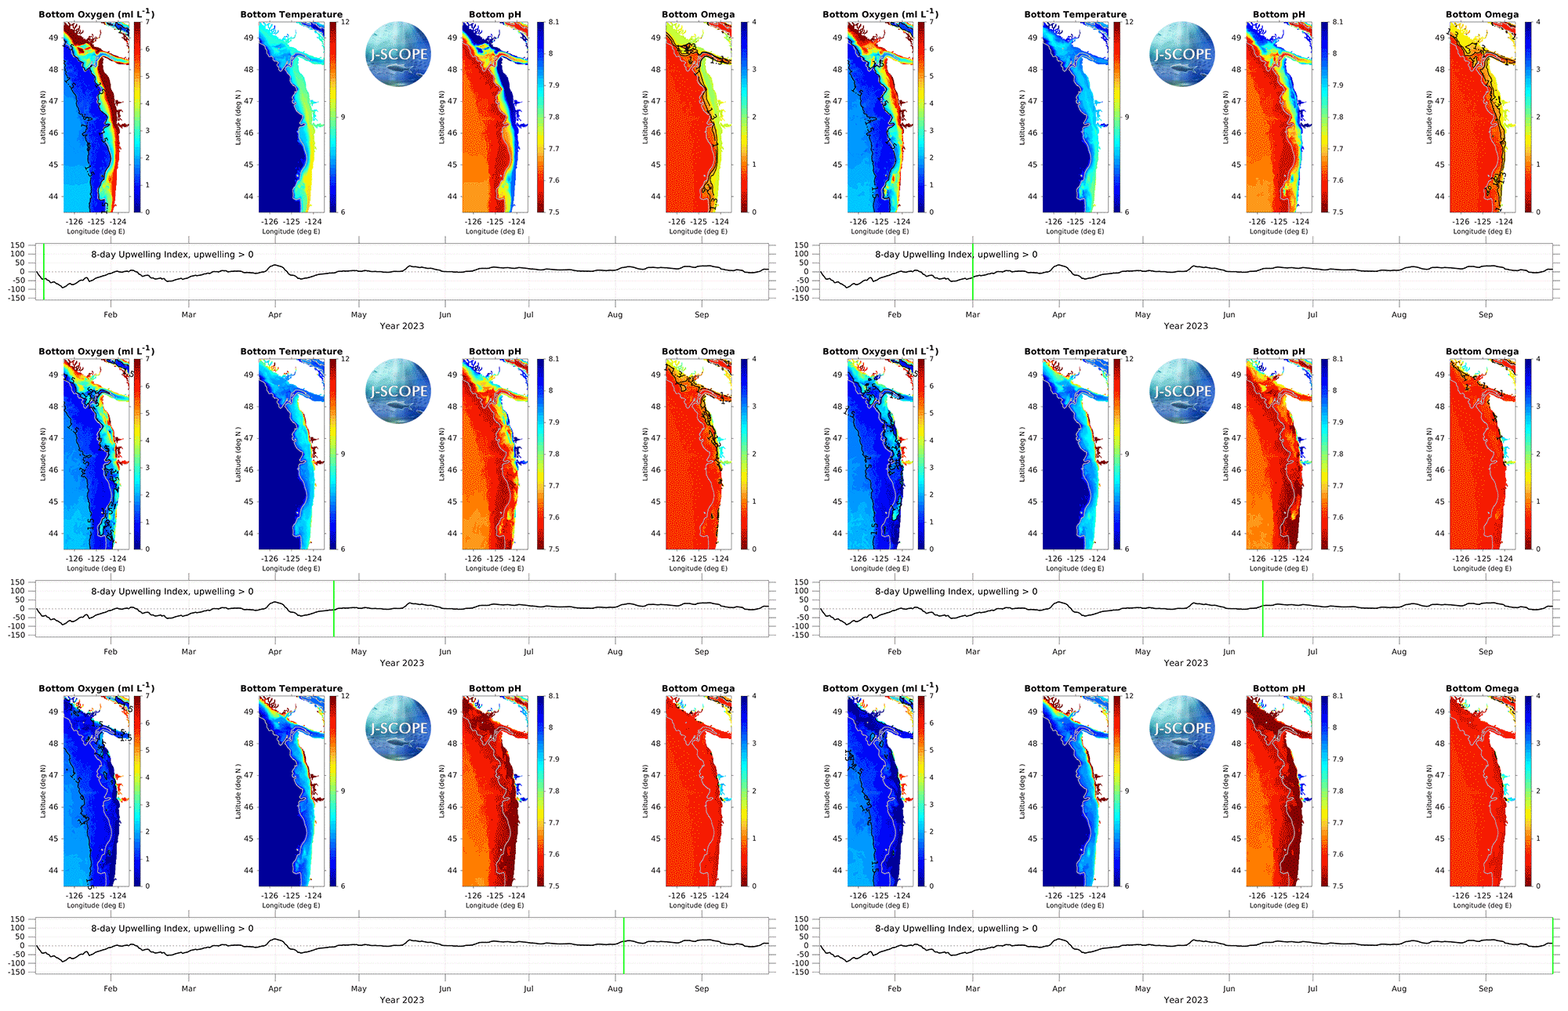
The movie above shows the J-SCOPE forecast for 2023, from ensemble model run 3 initialized on January 25. The 8-day upwelling index is calculated using the method described in Austin and Barth (2002) and can also be found under the California Current Indicators tab above.
Surface Fields
Aragonite saturation state at the sea surface is forecasted to increase over the spring and into the upwelling season (May - August), with saturation states peaking in late summer (July - August).
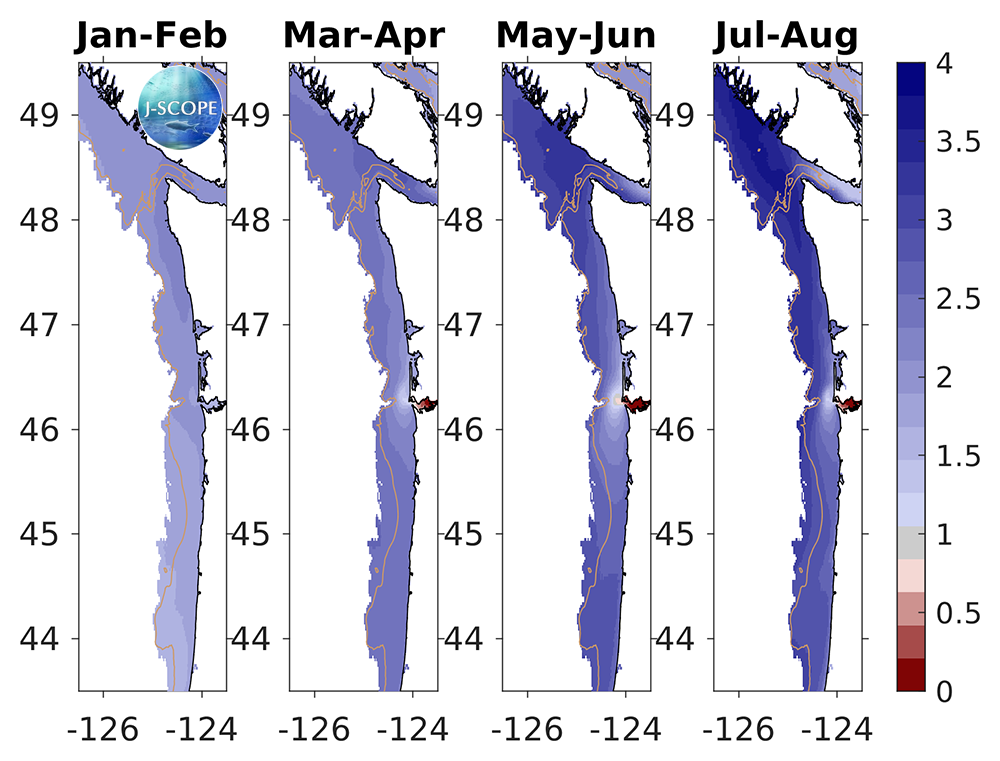
The modeled region surface aragonite saturation state (Ω) averaged over all three ensemble members and in time for (from left to right) January - February, March - April, May - June, July - August. For reference, Ω = 1 is the physical chemistry defined boundary between undersaturated and saturated conditions, but stressful conditions for juvenile oysters begin to occur before the waters become undersaturated (Ω = 1.3). The 200m isobath is outlined by the beige contour line.
Bottom Fields
Aragonite saturation state at the seafloor is forecasted to decrease over the course of the spring and summer. Most of the modeled region is forecasted to be undersaturated for the entire upwelling season.
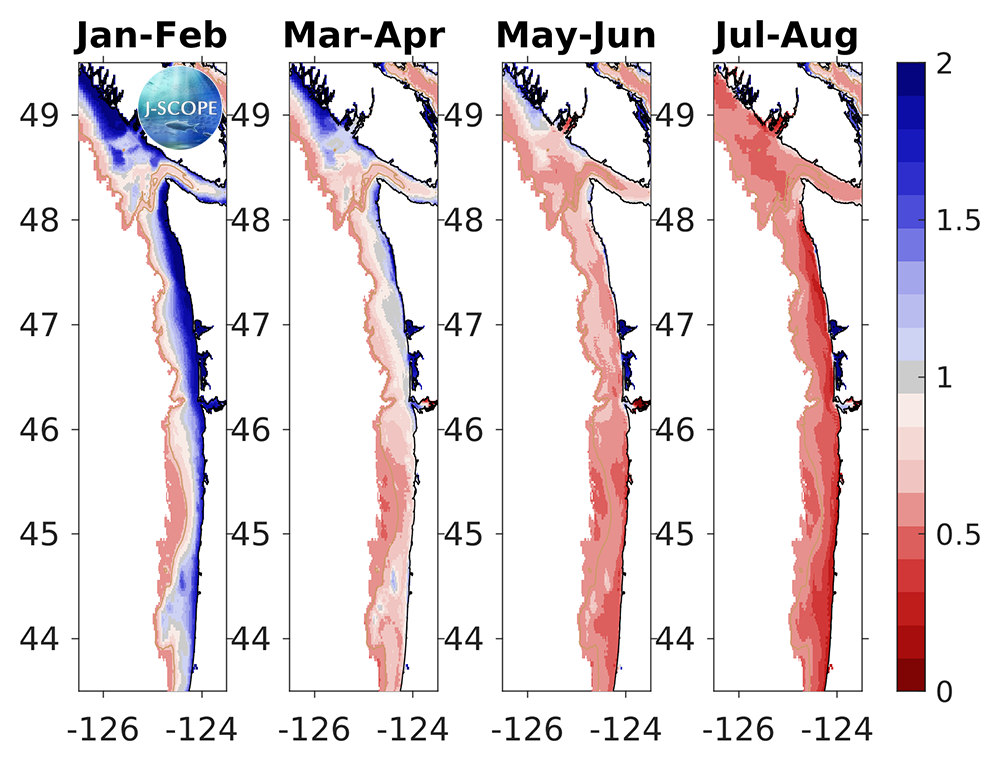
The modeled region bottom aragonite saturation state (Ω) averaged over all three ensemble members and in time for (from left to right) January - February, March - April, May - June, July - August. For reference, Ω = 1 is the physical chemistry defined boundary between undersaturated and saturated conditions, but stressful conditions for juvenile oysters begin to occur before the waters become undersaturated (Ω = 1.3). The 200m isobath is outlined by the beige contour line.
Severity Index
In development.
