Year in Review
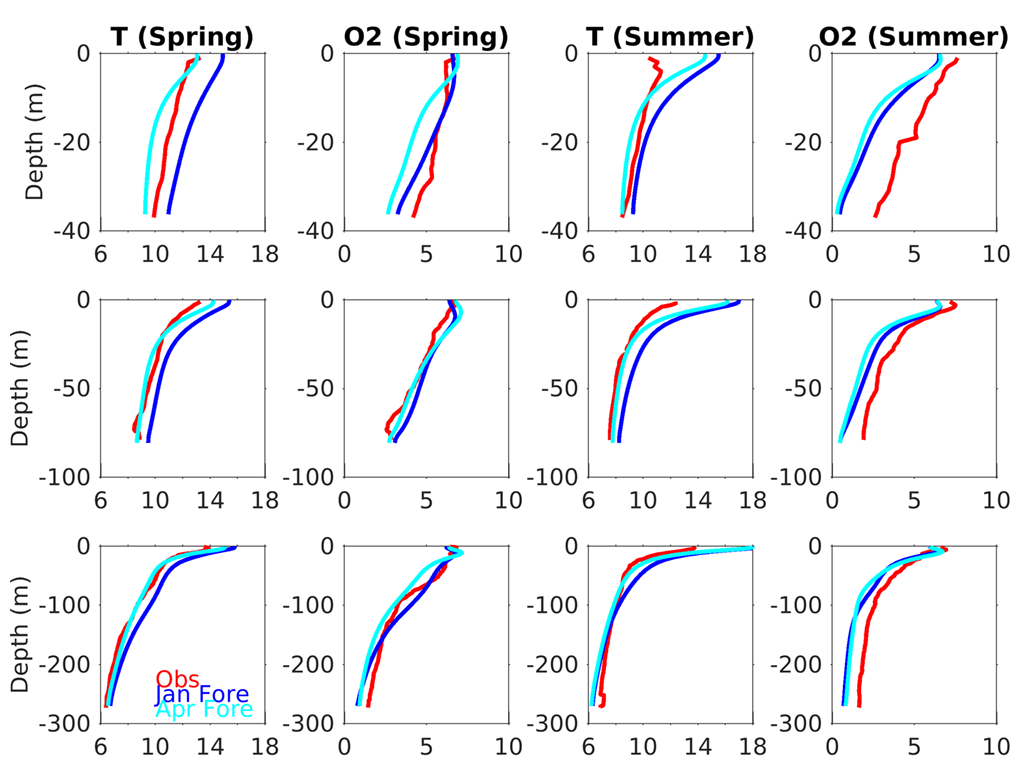
To quantify how representative our January and April model forecasts are of reality, the model forecasts were compared to co-located CTD measurements for the spring and summer of 2016. Temperature and oxygen profile comparisons are presented for three locations along the Newport line from the inner, mid, and outer shelf of Oregon (NH03, NH-10, and NH25). The model fields were extracted from the same location as the observations for each time period.
A comparison of January-initialized and April-initialized model forecasts and observations from three locations (inner, mid, and outer shelf) along the Newport Line on the Oregon shelf. The modeled fields (January forecast - teal, April forecast - darker blue) were extracted at each location and depth. The observations (red) are based on twice-monthly samples. Temperature and oxygen profiles are shown for Spring (April - June) and Summer (July - September).
